The final session of the first day of bpmNEXT 2018 was focused on advanced modeling techniques.
Designing the Data-Driven Company, MID GmbH
Elmar Nathe of MID GmbH presented on their enterprise decision maps, which provides an aggregated visualization of strategic, tactical and operational decisions with business events. They provide a variety of modeling tools, but see decisions as key to understanding how organizations are driven by data and events. Clearly a rich decision modeling environment, including support for PMML for including predictive models and other data scientist analysis tools, plus links to other model types such as ERDs that can show what data contributes to which decision model, and business process models. Much more of an enterprise architecture approach to model-driven design that can incorporate the work of data scientists.
Using Customer Journeys to Connect Theory with Reality, Signavio
Till Reiter and Enrico Teterra of Signavio started with a great example of an Ignite presentation, with few words, lots of graphics and a bit of humor, discussing their new notation for modeling an outside-in view of the customer journey rather than just having an undifferentiated “customer” swimlane in a BPMN diagram. The demo walked through their customer journey mapping tool, and how their collaboration hub overlays on that to allow information about each component of the journey map to be discussed amongst process modeling users. The journey map contains a lot of information about KPIs and other process metrics in a form most consumable by process owners and modelers, but also has a notebook/dashboard view for analysts to determine problems with the process and identify potential resolution actions. This includes a variety of analysis tools including process discovery, where process mining techniques are applied to determine which paths in the process model may be contributing to specific problems such as cycle time, then overlay this on the process model to assist with root cause analysis. Although their product does a good job of combing CJMs, process models and process analysis, this was more of a walkthrough of a set of pre-calculated dashboard screens rather than an actual demo — a far cry from the experimental features that Gero Decker showed off in their demo at the first bpmNEXT.
Discovering the Organizational DNA, IYCON and Knowledge Consultants
The final presentation of this section was with Jude Chagas Pereira of IYCON and Frank Kowalkowski of Knowledge Consultants presenting IYCON’s Afterspyre modeling tool for creating a catalog of complex business objects, their attributes and their linkages to create organizational DNA diagrams. Ranking these with machine learning algorithms for semantic and sentiment analysis allows identification of process improvement opportunities. They have a number of standard business analysis techniques built in, and robust analytics focused on problem solving. The demo walked through their catalog, drilling down into the “Strategy DNA” section and into “Technology Solutions” subsection to show an enumeration of the platforms currently in place together with attributes such as technology risk and obsolescence, which can be used to rank technology upgrade plans. Relationships between business objects can be auto-detected based on existing data. Levels including Objectives, Key Processes, Technology Solutions, Database Technology and Datacenter and their interrelationships are mapped into a DNA diagram and an alluvial diagram, starting at any point in the catalog and drilling down a specific number of levels as selected by the modeling analyst. These diagrams can then be refined further based on factors such as scaling the individual markers based on actual performance. They showed sentiment analysis for a hotel rank on a review site, which included extracting specific phrases that related to certain sentiments. They also demonstrated a two-model comparison, which compared the models for two different companies to determine the overlap and unique processes; a good indicator for a merger/acquisition (or even divestiture) level of difficulty. They finished up with affinity modeling, such as the type used by Amazon when they tell you what books that other people bought who also bought the book that you’re looking at: easy to do in a matrix form with a small data set, but computationally intensive once you get into non-trivial amounts of data. Affinity modeling is most commonly used in marketing to analyze buying habits and offering people something that they are likely to buy, even if that’s what they didn’t plan to buy at first — this sort of “would you like fries with that” technique can increase purchase value by 30-40%. Related to that is correlation modeling, which can be used as a first step for determining causation. Impressive semantic data-driven analytics tool for modeling a lot of different organizational characteristics.
That’s it for day one; if everyone else is as overloaded with information as I am, we’re all ready for tonight’s wine tasting! Check the Twitter stream for opinions and photos from other attendees.
 Bruce Silver, also a huge contributor to BPMN and DMN standards, and author of the BPMN Method & Style books and now the DMN M&S, presented an application for buying a stock at the right time based on price patterns. For investors who time the market based the pricing, the best way to do this is to look at daily min/max trends and fit them to one of several base type models. Bruce figured that this could be done with a decision table applied to a manipulated version of the data, and automated this for a range of stocks using a one-year history, processing in Excel, and decision services in the Trisotech cloud. This is a practical example of using decision services in a low-code environment by non-programmers to do something useful. His demo showed us the decision model for doing this, then the data processing (smoothing) done in Excel. However, for an application that you want to run every day, you’re probably not going to want to do the manual import/export of data, so he showed how to automate/orchestrate this with
 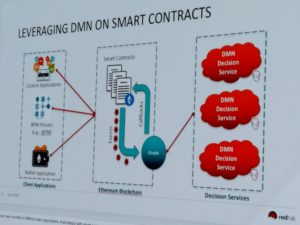 Edson Tirelli of Red Hat, Bruce Silver’s co-author on the above-mentioned DMN Cookbook, finished this section of DMN presentations with a combination of blockchain and DMN, where DMN is used to define the business language for calculations within a smart contract. His demo showed a smart land registry case, specifically a transaction for selling a property involving a seller, a buyer and a settlement service created in DMN that calculates taxes and insurance, with the purchase being executed using cryptocurrency. He mentioned
 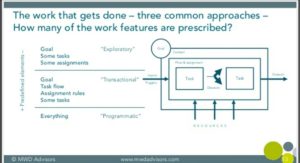 Neil Ward-Dutton, who heads up MWD Advisors, presented a distillation of the conversations that they’re having with customer organizations, starting with the difficult choices that they have to make in terms of which technologies to choose: for example, when RPA vendors tell them that they don’t need BPM any more. he went through some insights into the technologies that are impacting CIOs’ strategic decisions — no surprises there — then presented a schematic model for how work happens in organizations as a basis for understanding how different technologies impact different parts of their work. The framework categorizes work into exploratory, transactional and programmatic, and he walked through what each of those types defines up front, and how the technologies are used within that. Good view of how to help organizations think about their work and how to develop automation strategies that address different work styles and applications.