First session of the afternoon on the first day of bpmNEXT 2018, and this entire section is on DMN (decision management notation) and the requirement for decision automation based on DMN.
Decision as a Service (DaaS): The DMN Platform Revolution, Trisotech
Denis Gagne of Trisotech, who knows as much about DMN and other related standards as anyone around, started off the session with his ideas on the need for decision automation driven by requirements such as GDPR. He walked through their suite of decision-related products that can be used to create decision services to be consumed by other applications, as well as their conformance to the DMN standards. His demo showed a decision model for determining the best price to offer a rental vehicle customer, and walked through the capabilities of their platform with this model: DMN style check, import/export, execution, team collaboration, and governance through versioning. He also showed how decision models can be reused, so that elements from one model can be used in another model. Then, he showed how to take portions of the model and define them as a service using a visual wrapper, much like a subprocess wrapper visualization in BPMN, where the relationship lines that cross the service boundary become the inputs and outputs to the service. Cool. The service can then be deployed as an executable service using (in his demo) the Red Hat platform, test its execution using from a generated HTML form, generate the REST API or Open API interface code, run predefined test cases based on DMN TCK, promote the service from test to production, and publish it to an API publisher platform such as WSO2 for public consumption. The execution environment includes debugging and audit logs, providing traceability on the decision services.
 Bruce Silver, also a huge contributor to BPMN and DMN standards, and author of the BPMN Method & Style books and now the DMN M&S, presented an application for buying a stock at the right time based on price patterns. For investors who time the market based the pricing, the best way to do this is to look at daily min/max trends and fit them to one of several base type models. Bruce figured that this could be done with a decision table applied to a manipulated version of the data, and automated this for a range of stocks using a one-year history, processing in Excel, and decision services in the Trisotech cloud. This is a practical example of using decision services in a low-code environment by non-programmers to do something useful. His demo showed us the decision model for doing this, then the data processing (smoothing) done in Excel. However, for an application that you want to run every day, you’re probably not going to want to do the manual import/export of data, so he showed how to automate/orchestrate this with Microsoft Flow, which can still use the Excel sheet for data manipulation but automate the data import, execute the decision service, and publish the results back to the same Excel file. Good demonstration of the democratization of creating decisioning applications by through easy-to-use tools such as the graphical DMN modeler, Excel and Flow, highlighting that DMN is an execution language as well as a requirement language. Bruce has also just published a new book, DMN Cookbook, co-authored with Edson Tirelli of Red Hat, on getting started DMN business implementations using lightweight stateless decision services called via REST APIs.
Smarter Contracts with DMN, Red Hat
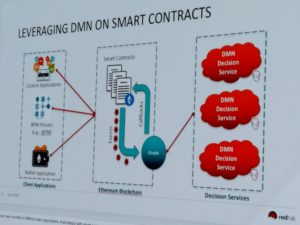 Edson Tirelli of Red Hat, Bruce Silver’s co-author on the above-mentioned DMN Cookbook, finished this section of DMN presentations with a combination of blockchain and DMN, where DMN is used to define the business language for calculations within a smart contract. His demo showed a smart land registry case, specifically a transaction for selling a property involving a seller, a buyer and a settlement service created in DMN that calculates taxes and insurance, with the purchase being executed using cryptocurrency. He mentioned Vanessa Bridge’s demo from earlier today, which showed using BPMN to define smart contract flows; this adds another dimension to the same problem, and likely no reason why you wouldn’t use them all together given the right situation. Edson said that he was inspired, in part, by this post on smart contracts by Paul Lachance, in which Lachance said “a visual model such as a BPMN and/or DMN diagram could be used to generate the contract source code via a process-engine”. He used Ethereum for the blockchain smart contract and the Ether cryptocurrency, Trisotech for the DMN models, and Drools for the rules execution. All in all, not such a far-fetched idea.
I’m still catching flak for suggesting the now-ubiquitous Ignite style for presentations here at bpmNEXT; my next lobbying effort will be around restricting the maximum number of words per slide. 🙂

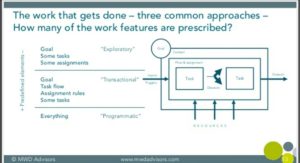 Neil Ward-Dutton, who heads up MWD Advisors, presented a distillation of the conversations that they’re having with customer organizations, starting with the difficult choices that they have to make in terms of which technologies to choose: for example, when RPA vendors tell them that they don’t need BPM any more. he went through some insights into the technologies that are impacting CIOs’ strategic decisions — no surprises there — then presented a schematic model for how work happens in organizations as a basis for understanding how different technologies impact different parts of their work. The framework categorizes work into exploratory, transactional and programmatic, and he walked through what each of those types defines up front, and how the technologies are used within that. Good view of how to help organizations think about their work and how to develop automation strategies that address different work styles and applications.
 He discussed the myth of the simple relationship between automation and employment, and how automating a task does not, in general, put people out of work, but just changes what their job is. People working together with the automation make for more streamlined (automated) standard processes with the people focused on the things that they’re best at: handling exceptions, building relationships, making complex decision, and innovating through the lens of combining human complexity with computational thinking.
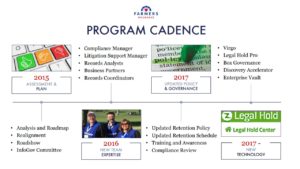 In the last Thursday breakout of AIIM 2018, I attended a session on initiatives within the compliance department at Farmers Insurance to modernize their records management, presented by Rafael Moscatel. Their technology includes IGS’ Virgo to manage retention schedules, Legal Hold Pro for legal holds and custodian compliance, and Box for content governance. They started in 2015 with an assessment and plan, then built a new team with the appropriate expertise going forward, then updated their policy and governance, and finally brought in the three new key technology components in 2017. For an insurance company, that’s pretty fast.
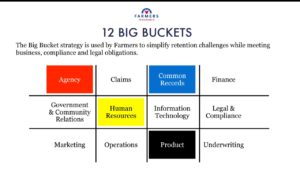 Their retention policy is based on 12 big buckets, which are primarily aligned with business functions, making it easy for employees to understand what they are from a real-world standpoint. Legal Hold Pro replaced an old customized SharePoint system, and works together with Box Governance for e-discovery. He went through a lot of the details of how the technologies work together and what they’re doing with them, but the key takeaway for me is that an insurance company — what I know through a lot of experience to be an
 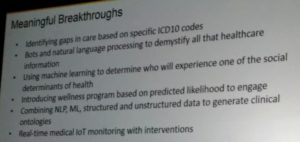 Abdul and his team have built a smart healthcare suite of applications that are based on a broad foundation of data sources: he sees the data as being key, since you can’t look for patterns or detect early symptoms without the data on which to apply the intelligent algorithms. With aggregate data from a wider population and specific data for a patient, intelligent healthcare can provide much more personalized, targeted recommendations for each individual. They’ve made a number of meaningful breakthroughs in applying AI technologies to healthcare services, such as identifying gaps in care based on treatment codes, and doing real-time monitoring and intervention via IoT devices such as fitness trackers.
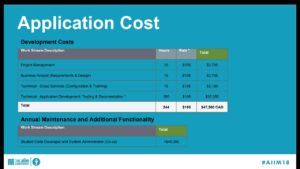 It sounds as if most of the original work was done by a single developer, and now they have new functionality created by one student developer; on top of that, since it’s cloud-based, there’s no infrastructure cost for servers or software licences, just subscription costs for Google Apps. They keep development in-house both to reduce costs and to speed deployment. Compare the chart on the right with the cost and time for your usual content and records management project — there are no zeros missing, the original development cost was less than $50k (Canadian). That streamlined technology path has also inspired them to streamline their records management policies: now, changes to the retention schedule that used to require a year and five signatures can now be signed off by the City Clerk alone.