Process Intelligence at KofaxTransform

It’s after lunch on the second (last) day of Kofax Transform, and the bar for keeping my attention in a session has gone up somewhat. To that end, I’m in a session with Scott Opitz and Rich Rabin from the Kofax Altosoft division, but not sure it’s going to meet that bar since Opitz started out by stating that what the TotalAgility (KTA) sessions call process is a much more complex than what they call process, and I’m a bit more on KTA’s side of this definition.

Altosoft process intelligence is really about the simple milestone-based monitoring processes of operational intelligence, with the processes being executed on multiple systems, more like SAP’s SAP Operational Process Intelligence based on HANA or IBM Business Monitor; you rarely have all of your process milestones in a single system, and even if you do, that system may not have adequate operational intelligence capabilities. Instead, operational intelligence systems pick up the breadcrumbs left by the processes — such as events, database records or log files — and provide an analytics layer, usually after importing that data into a dedicated analytics datamart.

There are really two main things to measure with process intelligence: performance and quality/compliance. To get there, however, you need to know what the process is supposed to look like in order to measure patterns of behavior. Altosoft’s process intelligence does what they call “swimlane analysis” — looking at which tasks are done in which order, a form of process mining discovery algorithm since there is no a priori process model — to identify operational patterns and derive a process model from runtime data, showing the most common/expected paths as well as the outliers. Not just process mining as an analysis tool, it then shows the live process monitoring data points against those models, and provides some good interactive filtering capabilities, allowing you to find missing steps that may indicate that the task wasn’t performed or (more likely for steps with manual logging) that the task was not documented.

Since the Insight platform is a complete BI environment, this information can also be combined with more traditional BI analytics and dashboards, providing real-time alerts as well as historical analysis. They also have ways to use a predefined process model and measure against that; this then becomes more of a conformance analysis to see how closely the actual runtime data matches the a prioiri model.

Kofax Altosoft For Operational Intelligence

Wayne Chambliss and Rich Rabin of Kofax Altosoft gave a presentation at Kofax Transform, most of which was a demo, on becoming an operational intelligence guru. This is my first real look at the Altosoft analytics product, acquired by Kofax about two years ago, since that’s not my main focus unless it’s particularly tied to process in some way.

Rabin used their graphical design tool to define the location of the metrics datamart, the data source (a variety of databases, or a file drop location), then define metrics by mapping the data fields, and applying aggregations and formatting. Although there is inherent complexity in understanding the use of the underlying data, the tool seems to make it pretty easy and fast to define the data and metrics, then load the data into the datamart and calculating the initial metrics. Once that was done,  he created a graphical dashboard related to the defined metrics, and could preview and run it directly. No SQL, no coding. If you want to get more complex, there’s a full expression editor, but everything is still done graphically within the same tool. You can directly examine the underlying generated SQL if you really want to.

It’s also possible to create a record to use as a data source, which is a similar abstraction concept to a database view, but with the addition functionality of heterogeneous data sources, derived fields, mappings and even field renaming. This allows someone to create metrics and dashboards based on records, without having to understand the underlying data sources.

Lots of other functionality here, including setting user authentications and access rights, scheduled loading of data sources into the metrics mart, dynamic filtering on dashboards and pivoting charts, much of which is available directly to the end users on the dashboard.

He wrapped up with a very brief process intelligence demo, where it’s possible to specify metrics directly based on a Kofax document capture process.

Event Analytics in Oil and Gas at TIBCONOW

Michael O’Connell, TIBCO’s chief data scientist, and Hayden Schultz, a TIBCO architect, discussed and demonstrated an event-handling example using remote sensor data with Spotfire and Streambase. One oil company may have thousands of submersible pumps moving oil up from well, and these modern pumps include sensors and telemetry to allow them to be monitored and controlled remotely. One of their oil and gas customers said that through active monitoring and control such as this, they are avoiding downtime worth $1000/day/well, meaning an additional $100M in additional revenue each year. In addition to production monitoring, they can also use remote monitoring in drilling operations to detect conditions that might be a physical risk. They use standards for sensor data format, and a variety of data sources including SAP HANA.

For the production monitoring, the submersible pumps emit a lot of data about their current state: monitoring for changes to temperature, pressure and current shows patterns that can be correlated with specific pre-failure conditions. By developing models of these pre-failure patterns using Spotfire’s data discovery capabilities on historical failure data, data pushed into Streambase can be monitored for the patterns, then Spotfire used to trigger a notification and allow visualization and analytics by someone monitoring the pumps.

We saw a demonstration of how the pre-failure patterns are modeled in Spotfire, then how the rules are implemented in Streambase for real-time monitoring and response using visual modeling and some XML snippets generated by Spotfire. We saw the result in Streambase LiveView, which provides visualization of streaming data and highlights those data points that are exhibiting the pre-failure condition. The engineers monitoring the pumps can change some of the configuration of the failure conditions, allowing them to fine-tune to reduce false positives without missing actual failure events. Events can kick off notification emails, generate Spotfire root cause analysis reports, or invoke other applications such as instantiating a BPM process.

There are a number of similar industrial applications, such as in mining: wherever there are a large number of remote devices that require monitoring and control.

AMX BPM and Analytics at TIBCONOW

Nicolas Marzin, from the TIBCO BPM field group, presented a breakout session on the benefits of combining BPM and analytics — I’m not sure that anyone really needs to be convinced of the benefits, although plenty of organizations don’t implement this very well (or at all) so it obviously isn’t given a high priority is some situations.

BPM analytics have a number of different audiences — end users, team leaders, live of business managers, and customer service managers — and each of them are interested in different things, from operational performance to customer satisfaction measures. Since we’re talking about BPM analytics, most of these are focused on processing work, but different views and aspects of that process-related information. Regardless of the information that they seek, the analytics need to be ease to use as well as informative, and focused on how analytics is more driven by questions that more static reporting.

There are some key BPM metrics regardless of industry:

  • Work backlog breakdown, including by priority, segment and skillset (required to determine resourcing requirements) or SLA status (required to calculate risk)
  • Resource pool and capacity
  • Aggregate process performance
  • Business data-specific measures, e.g., troublesome products or top customers

Monitoring and analytics are important not just for managing daily operations, but also to feed back into process improvement: actions taken based on the analytics can include work reprioritization, resource reallocation, or a request for process improvement. Some of these actions can be automated, particularly the first two; there’s also value in doing an in situ simulation to predict the impacts of these actions on the SLAs or costs.

By appropriately combining BPM and analytics, you can improve productivity, improve visibility, reduce time to action and improve the user experience. A good summary of the benefits; as I mentioned earlier, this is likely not really news to the customer in the audience, but I am guessing that a lot of them are not yet using analytics to the full extent in their BPM implementations, and this information might help them to justify it.

In AMX BPM, Spotfire was previously positioned for analytics and visualization, but TIBCO’s acquisition of Jaspersoft means that they are now bundling Jaspersoft with AMX BPM. You can use either (or both), and I think that TIBCO needs to get on top of identifying the use cases for each so that customers are not confused by two apparently overlapping BPM analytics solutions. Spotfire allows for very rich interactive visualizations of data from multiple sources, including drill-downs and what-if scenarios, especially when the analysis is more ad hoc and exploratory; Jaspersoft is better suited for pre-defined dashboards for monitoring well-understood KPIs.

TIBCONOW 2014 Day 2 Keynote: Product Direction

Yesterday’s keynote was less about TIBCO products and customers, and more about discussions with industry thought leaders about disruptive innovation. This morning’s keynote continued that theme with a pre-recorded interview with Vivek Ranadive and Microsoft CEO Satya Nadella talking about cloud, mobile, big data and the transformational effects on individual and business productivity. Nadella took this as an opportunity to plug Microsoft products such as Office 365, Cortana and Azure; eventually he moved on to talk about the role of leadership in providing a meaningful environment for people to work and thrive. Through the use of Microsoft products, of course.

Thankfully, we then moved on to actual TIBCO products.

We had a live demo of TIBCO Engage, their real-time customer engagement marketing product, showing how a store can recognize a customer and create a context-sensitive offer that can be immediately consumed via their mobile app. From the marketer’s side, they can define and monitor engagement flows — almost like mini-campaigns, such as social sharing in exchange for points, or enrolling in their VIP program — that are defined by their target, trigger and response. The target audience can be filtered by past interests or demographics; triggers can be a combination of geolocation (via their app), social media interactions, shopping cart contents and time of day; and responses may be an award such as loyalty points or a discount coupon, a message or both, with a follow link customized to the customer. A date range can then be set for each engagement flow, and set to be live/scheduled to start, or in a draft or review mode. Analytics are gathered as the flows execute, and the effectiveness can be measured in real time.

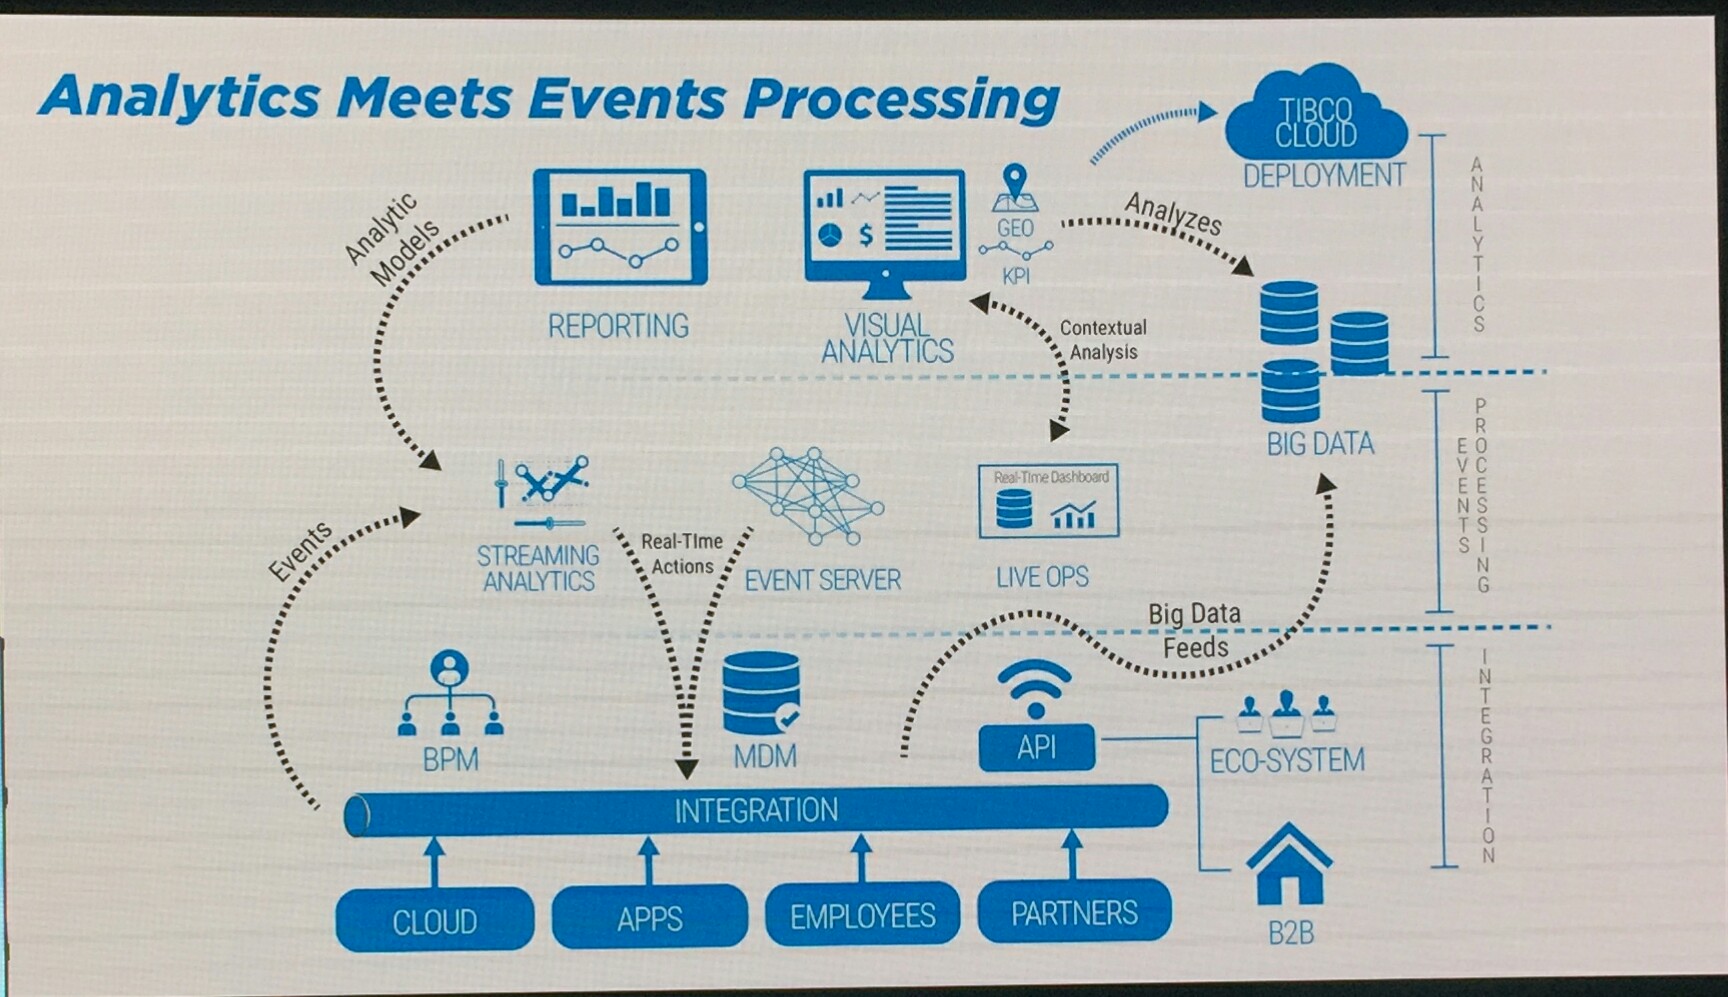
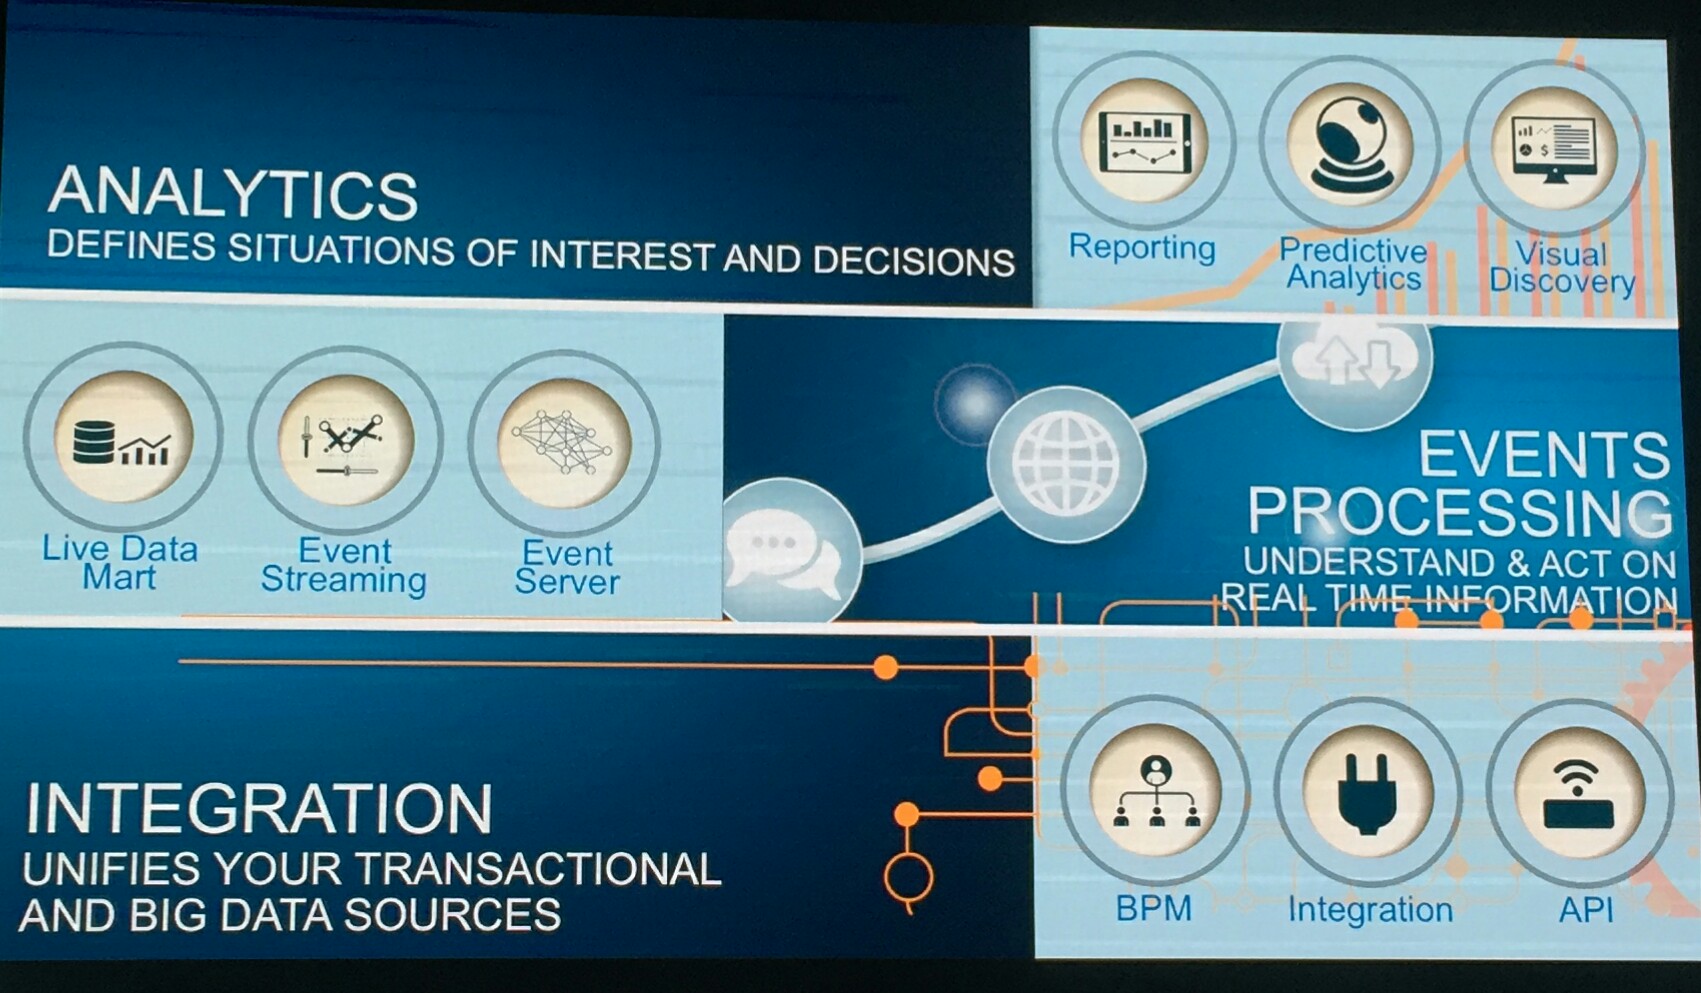
Matt Quinn, TIBCO’s CTO, spoke about the challenges of fast data: volume, speed and complexity. We saw the three blocks of the TIBCO Fast Data platform — analytics, event processing, and integration — in a bit more detail, with him describing how these three layers work together. Their strategy for the past 12 months, and going forward, has three prongs: evolution of the Fast Data platform; improved ease of use; and delivery of the Fast Data platform including cloud and mobile support. The Fast Data platform appears to be a rebranding of their large portfolio of products as if it were a single integrated product; that’s a bit of marketing-speak, although they do appear to be doing a better job of providing integrations and use cases of how the different products within the platform can be combined.

image

In the first part of the strategy, evolution of the platform (that is, product enhancements and new releases), they continue to make improvements to their messaging infrastructure. Fast, secure message transactions are where they started, and they continue to do this really well, in software and on their FTL appliances. Their ActiveSpaces in-memory data grid has improved monitoring and management, as well as multi-site replication, and is now more easily consumed via Node.js and other lighter-weight development protocols. BusinessWorks 6, their integration IDE, now provides more integrated development tooling with greatly improved user interfaces to more easily create and deploy integration applications. They’ve provided plug-ins for SaaS integrations such as Salesforce, and made it easier to create your own plug-ins for integration sources that they don’t yet support directly. On the event processing side, they’ve brought together some related products to more easily combine stream processing, rules and live data marts for real-time aggregation and visualization. And to serve the internet of things (IoT), they are providing connectivity to devices and sensors.

image

User experience is a big challenge with any enterprise software company, especially one that grows through acquisition: in general, user interfaces end up as a hodge-podge of inconsistent interfaces. TIBCO is certainly making some headway at refactoring these into a more consistent and easier to use suite of interfaces. They’ve improved the tooling in the BusinessWorks IDE, but also in the administration and management of integrations during development, deployment and runtime. They’ve provided a graphical UI designer for master data management (MDM). Presented as part of the ease of use initiative, he discussed the case management functions added to AMX BPM, including manual and automatic ad hoc tasks, case folder and documents with CMIS/ECMS access, and support for elastic organization structures (branch model). BPM reporting has also been improved through the integration of Jaspersoft (acquired by TIBCO earlier this year) with out of the box and customizable reports, and Jaspersoft also has been enhanced to more easily embed analytics in any application. They still need to do some work on interoperability between Jaspersoft and Spotfire: having two analytics platforms is not good for the customers who can’t figure out when to use which, and how to move between them.

The third prong of the strategy, delivery of the platform, is being addressed by offering on-premise, cloud, Silver Fabric platform-as-a-service, TIBCO Cloud Bus for hybrid cloud/on premise configurations, consumable apps and more; it’s not clear that you can get everything on every delivery platform, and I suspect that customers will have challenges here as TIBCO continues to build out their capabilities. In the near future, they will launch Simplr for non-technical integration (similar to IFTTT), and Expresso for consuming APIs. They are also releasing TIBCO Clarity for cleansing cloud data, providing cleaner input for these situational consumable apps. For TIBCO Engage, which we saw demonstrated earlier, they will be adding next best engagement optimization and support for third-party mobile wallets, which should improve the hit rate on their customer engagement flows.

He discussed some of the trends that they are seeing impacting business, and which they have on the drawing board for TIBCO products: socialization and gamification of everything; cloud requirements becoming hybrid to combine public cloud, private cloud and on premise; the rise of micro-services from a wide variety of sources that can be combined into apps; and HTML5/web-based developer tooling rather than the heavier Eclipse environments. They are working on Project Athena, a triplestore database that includes context to allow for faster decisioning; this will start to show up in some of the future product development.

Good review of the last year of product development and what to expect in the next year.

The keynote finished with Raj Verma, EVP of sales, presenting “trailblazer” awards to their customers that are using TIBCO technologies as part of their transformative innovation: Softrek for their ClearView CRM that embeds Jaspersoft; General Mills for their internal use of Spotfire for product and brand management; jetBlue for their use of TIBCO integration and eventing for operations and customer-facing services; and Three (UK telecom) for their use of TIBCO integration and eventing for customer engagement.

Thankfully shorter than yesterday’s 3-hour marathon keynote, and lots of good product updates.

Spotfire Content Analytics At TIBCONOW

(This session was from late yesterday afternoon, but I didn’t remember to post until this morning. Oops.)

Update: the speakers were Thomas Blomberg from TIBCO and Rik Tamm-Daniels from Attivio. Thanks, guys!

I went to the last breakout on Monday to look at the new Spotfire Content Analytics, which combines Spotfire in-memory analytics and visualization with Attivio content analysis and extraction. This is something that the ECM vendors (e.g., IBM FileNet) have been offering for a while, and I was interested to see the Spotfire take on it.

Basically, content analytics is about analyzing documents, emails, blogs, press releases, website content and other human-created textual data (also known as unstructured content) in order to find insights; these days, a primary use case is to determine sentiment in social media and other public data, in order for a company to get ahead of any potential PR disasters.

Spotfire Content Analytics — or rather, the Attivio engine that powers the extraction — uses four techniques to find relative information in unstructured content:

  • Text extraction, including metadata
  • Key phrase analysis, using linguistics to find “interesting” phrases
  • Entity extraction, identifying people, companies, places, products, etc.
  • Sentiment analysis, to determine degree of negative/positive sentiment and confidence in that score

Once the piece of content has been analyzed to extract this relevant information, more traditional analytics can be applied to detect patterns, tie these back to revenue, and allow for handling of potential high-value or high-risk situations.

Spotfire Content Analytics (via their ) uses machine learning that allows you to train the system using sample data, since the information that is considered relevant is highly dependent on the specific content type (e.g., a tweet versus a product review). They provide rich text analytics, seamless visualization via Spotfire, agility through combining sources and transformations, and support for diverse content sources. They showed a demo based on a news feed by country from the CIA factbook site (I think), analyzing and showing aggregate sentiment about countries: as you can imagine, countries experiencing war and plague right now aren’t viewed very positively. Visualization using Spotfire allows for some nice geographic map-based searching, as well as text searching. The product will be available later this month (November 2014).

Great visualizations, as you would expect from Spotfire; it will be interesting to see how this measures up to IBM’s and other content analytics offerings once it’s released.

TIBCONOW 2014 Opening Keynote: @Gladwell and More. Much More.

San Francisco! Finally, a large vendor figured out that they really can do a 2,500-person conference here rather than Las Vegas, it just means that attendees are spread out in a number of local hotels rather than in one monster location. Feels like home.

It seems impossible that I haven’t blogged about TIBCO in so long: I know that I was at last year’s conference but was a speaker (as I am this year) so may have been distracted by that. Also, they somehow missed giving me a briefing about the upcoming ActiveMatrix BPM release, which was supposed to be relatively minor but ended up  bit bigger — I’ll be at the breakout session on that later today.

We started the first day with a marathon keynote, with TIBCO CEO Vivek Ranadive welcoming San Francisco’s mayor, Ed Lee, for a brief address about how technology is fueling San Francisco’s growth and employment, as well as helping the city government to run more effectively. The city actually have a chief data officer responsible for their open data intiatives.

Ranadive addressed the private equity buy-out of TIBCO head-on: 15 years ago, they took the company public, and by the end of this year, they will be a private company again. I think that this is a good thing, since it removes them from the pressures of quarterly public filings, which artificially impacts product announcements and sales. It allows them to make any necessary organization restructuring or divestiture without being punished on the stock market. Also, way better than being absorbed by one of the bigger tech companies, where the product lines would have be to realigned with incumbent technologies. He talked about key changes in the past years: the explosion of data; the rise of mobility; the emergence of social platforms; Asian economies; and how math is trumping science by making the “how” more important than the “why”. Wicked problems, but some wicked solutions, too. He claims that every industry will have an “Uberization”: controversies aside, companies such as Uber and AirBnB are letting service businesses flourish on a small scale using technology and social networks.

We then heard from Malcolm Gladwell — he featured Ranadive in one of his books — on technology-driven transformation, and the kinds of attitudes that make this possible. He told the story of Malcolm McLean, who created the first feasible intermodal containerized shipping in the 1950s because of his frustration with how long it took to unload his truck fleet at seaports, and how that innovation transformed the physical goods economy. In order to do this, McLean had to overcome the popular opinion that containerized shipping would fail (based on earlier failed attempts by others): as Gladwell put it, he had the three necessary characteristics of successful entrepreneurs: he was open/imaginative with creative ideas; he was conscientious and had the discipline to bring ideas to fruition including a transformation of the supply chain and sales model; and he was “disagreeable”, that is, had the resolve to pursue an idea in the face of his peers’ disapproval and ridicule. Every transformative innovation must be driven by someone with these three traits, who has the imagination to reframe the incumbent business to address unmet needs, and kill the sacred cows. Great talk.

Ranadive then invited Marc Andreessen on stage for a conversation (Andreessen thanked him for letting him “follow Malcolm freaking Gladwell on the stage”) about innovation, which Andreessen says is currently driven by mobile devices: businesses now must assume that every customer is connected 24×7 with a mobile device. This provides incredible opportunities — allowing customers to order products/services on the go — but also threats for businesses behind the curve, who will see customers comparing them to their competitors in real-time before making a purchasing decision. They discussed the future of work; Andreessen sees this as leveraging small teams, but that things need to change to make that successful, including incentives (a particular interest of mine, since I’ve been looking at incentives for collaboration amongst knowledge workers). Diversity is becoming a competitive advantage since it draws talent from a larger pool. He talked about the success rates of typical venture-funded companies, such as those that they fund: of 4,000 companies, about 15 will make it to being big companies, that is, with a revenue of $100M or more that would position them to go public; most of their profits as a VC come from those 15 companies. They fund good ideas that look like terrible ideas, because if everyone thought that these were great ideas, the big companies would already be doing them; the trick is filtering out all of ideas that look terrible because they actually are. More important is the team: a bad team can ruin a good idea, but a great team with a bad idea can find their way to a good idea.

Next up was TIBCO’s CTO Matt Quinn talking with Box CEO Aaron Levie: Box has been innovating in the enterprise by taking the consumer cloud storage that we were accustomed to, and bringing it into the enterprise space. This not only enables internal innovation because of the drastically lower cost and simpler user experience than enterprise content solutions such as SharePoint, but also has the ability to transform the interface between businesses and their customers. Removing storage constraints is critical to supporting that explosion of data that Ranadive talked about earlier, enabling the internet of everything.

We saw a pre-recorded interview that Ranadive did with PepsiCo CEO Indra Nooyi: she discussed the requirement to perform while transforming, and the increase in transparency (and loss of privacy) as companies seek to engage with customers. She characterized a leader’s role as that of not just envisioning the future, but making that vision visible and attainable.

Mitch Barns, CEO of Nielsen (the company that measures and analyzes what people watch on TV), talked about how their business of measurement has changed as people went from watching broadcast TV at times determined by the broadcasters, to time-shifting with DVRs and consuming TV content on mobile devices on demand. They have had to shift their methods and business to accommodate this change in viewing models, and deal with a flood of data about how, when and where that consumption is occurring.

I have to confess, by this point, 2.5 hours into the keynote without a break, my attention span was not what it could have been. Or maybe these later speakers just didn’t inspire me as much as Gladwell and Andreessen.

Martin Taylor from Vista Equity Partners, the soon-to-be owners of TIBCO, spoke next about what they do and their vision for TIBCO. Taylor was at Microsoft for 14 years before joining Vista, and helps to support their focus on applying their best practices and operating platform to technology companies that they acquire. Since their start in 2000, they have spent over $14B on 140 transactions in enterprise software. He showed some of their companies; since most of these are vertical industry solutions, TIBCO is the only name on that slide that I recognized. They attempt to foster collaboration between their portfolio companies: not just sharing best practices, but doing business together where possible; I assume that this could be very good for TIBCO as a horizontal platform provider that could leveraged by their sibling companies. The technology best practices that they apply to their companies include improved product management roadmaps that address the needs of their customers, and improved R&D practices to speed product release cycles and improve quality. They’re still working through the paperwork and regulatory issues, but are starting to work with the TIBCO internal teams to ensure a smooth transition. It doesn’t sound as if there will be any big technology leadership changes, but a continued drive into new technologies including cloud, IoT, big data and more.

Murray Rode, TIBCO’s COO, finished up the keynote talking about their Fast Data positioning: organizations are collecting a massive volume of data, but that data has a definite shelf life and degrades in value over time. In order to take advantage of short-lived opportunities where timing is everything, you have to be able to analyze and take actions on that data quickly. As he put it, big data lets you understand what’s already happened, but fast data lets you influence what’s about to happen. To do this, you need to combine analytics to define situations of interest and decisions; event processing to understand and act on real-time information; and integration (including BPM) to unify your transactional and big data sources. Rode outlined the four themes of their positioning: expanded reach, ease of consumption, compelling user journey, and faster time to value; I expect that we will see more along these themes throughout the conference.

All in all, a great keynote, even though it stretched to an ass-numbing three hours.

Disclosure: TIBCO is paying my expenses to be at TIBCO NOW and a speaking fee for me to be on a panel tomorrow. What I write here is my own opinion, and I am not compensated in any way for blogging.

What’s New With SAP Operational Process Intelligence

Just finishing up some notes from my trip to SAP TechEd && d-code last week with the latest on their Operational Process Intelligence product, which can pull events and data from multiple systems – including SAP’s ERP and other core enterprise systems as well as SAP BPM – and provides real-time analytics via their HANA in-memory database. I attended a session on this, then had an individual briefing later to round things out.

Big processes are becoming a thing, and if you have big processes (that is, processes that span multiple systems, and consume/emit big data and high volume from a variety of sources), you need to have operational intelligence integrated into those processes. SAP is addressing this with their SAP Operational Process Intelligence, or what they see as a GPS for your business: a holistic view of where you are relative to your goals, the obstacles in your path, and the best way to reach your goals. It’s not just about what has happened already (traditional business intelligence), but what is happening right now (real-time analytics), what is going to happen (predictive analytics) and the ability to adjust the business process to accommodate the changing environment (sense and respond). Furthermore, it includes data and events from multiple systems, hence needs to provide scope beyond any one system’s analytics; narrow scope has been a major shortcoming of BPMS-based analytics in the past.

In a breakout session, Thomas Volmering and Harsh Jegadeesan gave an update and demo on the latest in their OPInt product. There are some new visualization features since I last saw it, plus the ability to do more with guided tasks including kicking off other processes, and trigger alerts based on KPIs. Their demo is based on a real logistics hub operation, which combines a wide variety of people, processes and systems, with the added complexity of physical goods movement.

Although rules have always been a part of their product suite, BRM is being highlighted as a more active participant in detecting conditions, then making predictions and recommendations, leveraging the ability to run rules directly in HANA: putting real-time guardrails around a business process or scenario. They also use rules to instantiate processes in BPM, such as for exception handling. This closer integration of rules is new since I last saw OPInt back at SAPPHIRE, and clearly elevates this from an analytics application to an operational intelligence platform that can sense and respond to events. Since SAP BPM has been able to use HANA as a database platform for at least a year, I assume that we will eventually see some BPM functionality (besides simple queuing) pushed down into HANA, as they have done with BRM, allowing for more predictive behavior and analytics-dependent functions such as work management to be built into BPM processes. As it is, hosting BPM on HANA allows the real-time data to be integrated directly into any other analytics, including OPInt.

OPInt provides ad hoc task management using a modern collaborative UI to define actions, tasks and participants; this is providing the primary “case management” capability now, although it’s really a somewhat simpler collaborative task management. With HANA behind the scenes, however, there is the opportunity for SAP to take this further down the road towards full case management, although the separation of this from their BPM platform may not prove to be a good thing for all of the hybrid structured/unstructured processes out there.

The creation of the underlying models looks similar to what I’ve been seeing from them for a while: the business scenario is defined as a graphical flow model (or imported from a process in Business Suite), organized into phases and milestones that will frame the visualization, and connected to the data sources; but now the rules can be identified directly on the process elements. The dashboard is automatically created, although it can be customized. In a new view (currently still in the lab), you will also be able to see the underlying process model with overlaid analytics, e.g., cost data; this seems like a perfect opportunity for a process mining/discovery visualization, although that’s more of a tool for an analyst than whoever might be monitoring a process in real-time.

camunda Community Day technical presentations

The second customer speaker at camunda’s community day was Peter Hachenberger from 1&1 Internet, describing how they use Signavio and camunda BPM to create their Process Platform, which is in turn used by their clients’ developers for building and executing automated processes. His presentation was primarily about the details of their technical implementation of the platform; they have built some fairly comprehensive tools for monitoring and managing executing processes, many of which are facilitated by changes that they made to the core process engine, including retry behavior, process ID generator, multiple business keys, an asynchronous process starter API, an extended REST API and a few new commands. Since camunda BPM is open source, any customer such as 1&1 can take a copy of the code and make changes to it, optionally returning them to the community if they are valuable to others. There’s a bit of danger in this, in that if you make changes to core functionality (such as the engine) rather than create an extension or plug-in, and those changes do not end up back in the community version, you’re not only on your own for future development on those components but may not be able to upgrade to future versions.

We had a number of short (10 minute) presentations from community members to discuss extensions that they are working on:

  • Grails plugin to add camunda functionality to Grails applications
  • OSGi module extension for greater flexibility and configurability at runtime, including sharing process engines as services
  • Elasticsearch extension to write camunda BPM history data to an elasticsearch cluster to allow full-text searching, enabling more comprehensive analytics
  • camunda mocking extensions for process testing with mockito
  • Cockpit plugin to add interactive graphs and some statistical calculations (e.g., aggregation, regression, min/max) for process monitoring directly on the camunda history database

Some of these extension projects were done by camunda employees, but great to see the external community contributions as well.

bpmNEXT 2014 Wrapup And Best In Show

I couldn’t force myself to write about the last two sessions of bpmNEXT: the first was a completely incomprehensible (to me) demo, and the second spent half of the time on slides and half on a demo that didn’t inspire me enough to actually put my hands on the keyboard. Maybe it’s just conference fatigue after two full days of this.

However, we did get a link to the Google Hangout recording of the BPMN model interchange demo from yesterday (be sure to set it to HD or you’ll miss a lot of the screen detail).

We had a final wrapup address from Bruce Silver, and he announced our vote for the best in show: Stefan Andreasen of Kapow – congrats!

I’m headed home soon to finish my month of travel; I’ll be Toronto-based until the end of April when IBM Impact rolls around.