Salesforce Releases Force.com Visual Process Manager

A couple of months back, there was a private discussion amongst the Enterprise Irregulars about who Salesforce.com was going to buy next, and there was a thought in the back of my mind that it might be a BPM vendor. Since that time, two BPM vendors have been acquired, but not by Salesforce: instead, they launched their own Force.com Visual Process Manager for designing and running processes in the cloud.

However, they seem determined to keep it a secret: first, the Visual Process Manager Demo video on YouTube has been made private (that’s just a screen snapshot of the cached video below), and second, I was unable to get a call back in response to the technical questions that I had during the demo.

For those of you unfamiliar with options for Salesforce application development ( as I mostly was before this briefing), Force.com is the platform originally built for customizing the Salesforce CRM offering, which became a necessity for larger customers requiring customization of data, UI and business logic. Customers started using it as a general business application development and delivery platform, and there are now 135,000 custom applications on Force.com, ranging from end-user-created databases and analytics, to sophisticated order management and e-commerce systems that link directly to customers and trading partners, and can update data from other Salesforce applications. In the past four years, they’ve gone from offering transactional applications to entire custom websites, and are now adding collaboration with Chatter.

As you might guess, there are processes embedded in many applications; classic software development might view these as screen flows, that is, the process for a person to move from one screen to another within an application. Visual Process Manager came about for exactly that purpose: customers were building departmental enterprise applications applications with process (screen flow) logic, but were having to use a lot of code in order to make it happen.

Link between form and process mapSalesforce acquired Informavores for their process design and execution engine, and that became Visual Process Manager. This is primarily human-centric BPM; it’s not intended as a system-centric orchestration platform, since most customers already have extensive middleware for integration, usually on-premise and already integrated with their Force.com apps so don’t need that capability. That means that although a process step can call a web service or pretty much anything else within their existing Force.com platform, asynchronous web service calls are not supported; this would be expected to be done by that middleware layer.

The process designer allows you to create a process map, then create a form that is tied to each human-facing step in the process map. Actions are bound to the buttons on the forms, where a form may be a screen for internal use, or a web page for a public user to access. You can also add in automated steps and decisions, as well as calling subprocesses and sending emails. It uses a fairly simple flowchart presentation for the process map, without swimlanes. There isn’t a lot of event handling that I could see, such as handling an external event that cancels an insurance quote process. There’s a process simulator, although that wasn’t demonstrated.

Visual Process Manager is priced at $50/user/month for Force.com Enterprise and Unlimited Edition customers, although it’s not clear if that’s just for the application developers, or if there’s a runtime licensing component as well.

Similar to what I said about SAP NetWeaver BPM, this isn’t the best BPMS around – in fact, in the case of Force.com, it’s little more than application screen flow – but it doesn’t have to be the best in class: it only has to be the best BPMS for Force.com customers.

ARISalign Online Process Modeling and BPM Community

There has been much speculation in the BPM world about Software AG’s online BPM community, originally dubbed AlignSpace, or as it has been recently renamed, ARISalign. Originally launched in a private beta months ago, those of us on the outside have been anticipating a look at how they plan to “combine social networking tools with intuitive tools for process design and modeling [to] collaborate effectively to create and improve processes”.

A few weeks ago, prior to the official beta release, I had a chance for a briefing with Thomas Stoesser of Software AG for a closer look, and I’ve been playing around with it myself since the beta opened. With ARISalign, they’re providing tools for collaboratively capturing business processes in an early process discovery stage, and also providing an open BPM community for anyone to participate, not just ARIS and webMethods users. In the future, they’re also planning for a marketplace for BPM-related products and services, although that’s not in the current offering.

Home screen
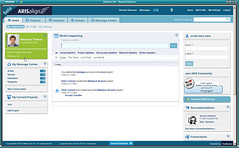
Logging in to ARISalign, you see a home dashboard that shows a feed of updates on your projects, groups, discussions and networks, plus a message center and a list of your current projects. There’s also a Facebook-like status feature, although I’m not sure that I’d use this feature since it’s unlikely to be my primary social network – I don’t even do Facebook status updates any more since I started Twittering.

Projects are how process artifacts are organized in ARISalign, with a project including a number of components:

  • A whiteboard, similar in appearance to Lombardi Blueprint and other process discovery tools, that allows users to add “stages”, then activities that belong to each stage. 
  • Any number of process maps that can be linked to, but not generated from, the activities on the whiteboard.
  • A discussion forum, which provides a simple threaded discussion board within the project.
  • A library of related files/documents that can be uploaded as background or reference materials. Currently, the library can only contain uploaded content, not links to content that is hosted elsewhere; links would have to be added in a discussion thread.

If you like the project framework but don’t plan to add process models, then a group has all the same features as a project except for the whiteboard and process maps: you can use it if you want only a discussion forum, library and timeline shared between a group of people.

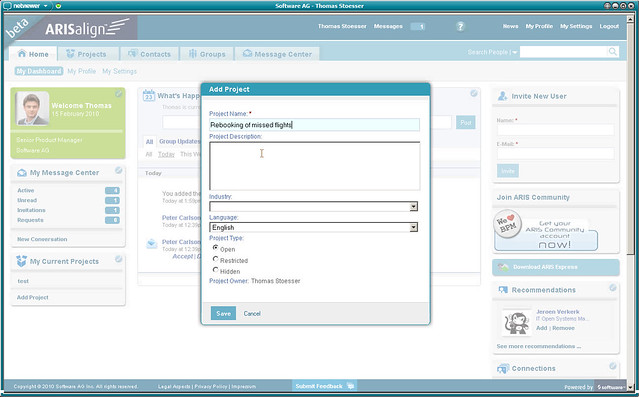
Creating a project requires only specifying a project name: everything else is optional or has some reasonable defaults. You can add a description, and select industry and language from predefined lists, although these are used as project search metadata only and don’t change the form of the project in any way. You can also select the access control for viewing the project, confusingly called “Project Type”, as open (visible to all), restricted (anyone can see the project in a search list, but not the details or content) or hidden (not visible to non-members, even in search results). All projects require that you join the project in order to participate, which may or may not require a process administrator’s approval.

There are three roles that a member can be assigned for a specific project:

  • Project administrator, including the project owner/creator, which allows all functions including administering members, changing user roles, and archiving and renaming content.
  • Project contributor, which allows working with tools and adding content.
  • Project reviewer, which allows viewing content, participating in discussions and adding comments, but not changing content such as process models.

Unfortunately, there is no way to change the project owner from the original creator, although this is in the future plans, as is the idea of creating project templates for faster startup.

For an existing project, members will often want to start on the project dashboard where they can view a feed of all activity on the project (echoing the personal dashboard for a user, which shows activities for a user, their projects and their network). Similar to functionality recently added to Facebook, a user can hide specific people, models and activities on the dashboard, which creates a filter of only their view, not everyone’s view of the project dashboard.

Comments indicator on activity
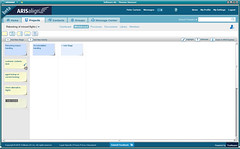
To get started with process modeling, however, you’ll start on the project’s whiteboard tab, a near-real-time collaborative process discovery tool. High-level process steps, or stages, are added, then activities added below each stage: a process discovery paradigm for non-process-oriented users to just list the steps that are involved in the process. All project members can see each other’s changes as they occur, and can invite additional project members directly from the whiteboard view. Activities can be assigned properties, including comments by project reviewers; activities with comments show a pencil icon on the activity so that others know that comments exist. In the future, activities will also be able to have attachments; currently, attachments can only be added to the project library.

The whiteboard view also allows adding goals and KPIs, although these are purely informational and can’t (yet) be applied to any process models created within that project. In the future, there may be value in considering how KPIs can be linked to the process models and exported for use in other tools.

Unlike some other process discovery tools, the whiteboard view does not auto-generate a process model – apparently there was quite a bit of internal design conversation over whether to do this or not – but one or more process models can be added to the project. Adding and editing a process model creates a split screen view with the whiteboard and the process model; activities can be dragged from the whiteboard to the process model, which creates a linkage between the activity in those two locations, such that highlighting the activity on the whiteboard also highlights it on the process model, and vice versa. Swimlanes and subprocesses in proces view - also, selecting linked activity in either view highlights both
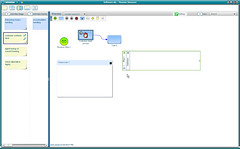
A whiteboard activity may be linked to more than one process model, so changes to the activity are not promoted to the process model. There can also be whiteboard activities that don’t end up on any process model. I’m not sure that I’m on board with this method; first of all, I would like to see a way to auto-generate a process model from the whiteboard, and I also think that if something is in the whiteboard view, it needs to be on a process model somewhere: otherwise, why is it in the whiteboard view at all? It appears that the reasoning behind this is that the process model is intended to be an executable process model, such that only the things that might end up in a BPMS would be included, whereas the whiteboard model includes purely manual tasks. Multiple processes from one whiteboard appears to make sense so that non-process people don’t have to think about what are distinct processes, but on second glance, I’m not sure that’s the right way to go.

The more we dig into this, the more that I’m left with the feeling that this is a front-end for webMethods, not an ARIS extension, although the process modeling palette looks more like ARIS Express rather than the webMethods Designer. ARISalign is intended to be a purely business tool, so doesn’t expose web services calls or other technical complexities.

Process models can be exported to webMethods format, XPDL, or opened directly in ARIS Express, but there’s no round-tripping since importing the model back from ARIS Express requires uploading it as a different project. ARIS Express now supports “whiteboard” collaborative models, so the whiteboard can be exported and opened in ARIS Express as well as the process model. There are no offline capabilities; the only offline alternative would be to export to ARIS Express, then upload the changed models to a different project or take screen snaps of the ARIS Express changes and add as images to the project library to document offline changes. Neither of these is particularly attractive, so this may not be an option if you have to have offline access. There are plans to improve the ARIS Express integration in the future, possibly allowing a process model to be downloaded and locked for editing in ARIS Express, then re-uploaded in place.

There’s a view of all process models in a project, which allows those models to be managed (renamed, exported, deleted), but any editing of the models occurs in the split-screen view with the project whiteboard.

Recommendations for connections
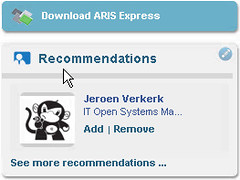
Aside from the project functionality, there are a number of social networking features for managing your profile and your connections. You can set different views of your profile for your network or for public display, and can view recommendations of people to whom you might want to connect based on company, industry and shared contacts. The Message Center is very Google Wave-like, with participants shown at the top, and allowing public or private reply to any part of the thread. This holds potential to become the conversation framework used within projects, to replace the current simple discussion groups. In general, the UI is quite nice (although some may not like that it was created with Adobe Flex), and has borrowed liberally from successful features of Facebook and other social networks. The navigation is quite flat, making it easy to find your way around in the interface.

Software AG also showed off an ARISalign iPhone app at CeBIT, although it’s not generally available yet. I’m not sure I’d use this for much process modeling, although it would be useful for tracking what’s happening on projects, accepting invitations, participating in discussions and even looking at (or some light editing of) the whiteboard view.

Currently, ARISalign is available only as a hosted solution, and is hosted on the US version of Amazon Web Services. It’s architected so that on-premise hosting could be enabled in the future, although not in the current version. Software AG should consider having a version hosted on the EU AWS instance, since many organizations don’t want their information – even process models that don’t contain customer data – hosted in the US due to the privacy laws.

This is the first publicly-available version of ARISalign, and no one expects it to be perfect. How quickly Software AG can respond to users’ requests for new functionality – such as the inclusion of a marketplace for add-on applications and services – will be the real test of success, as I mentioned in my recent review of the IBM BlueWorks community.

There’s also the issue of merging the existing ARIS Community with ARISalign or at least cross-linking user accounts, which seems a logical step, but is not permitted by Germany privacy laws until Software AG and IDS Scheer officially become a single company, which could be several months still. The two sites may not end up merged; you can imagine the ARIS Community site being left with product support for ARIS and remain more actively managed, while the user-generated content such as discussions as well as the more generic tools be moved over to ARISalign. You can be sure that there will be some internal politics around this decision, too. Regardless, in the mean time, there’s a badge in the sidebar of each site linking to the other, encouraging you to sign up on the other site. That might, however, cause a bit of social networking fatigue for many business users.
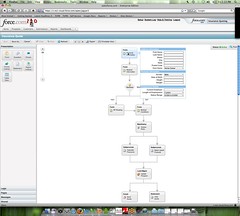
ARISalign

But Customers Don’t WANT Three BPMSs

In my Links post last Friday, I linked to a post on Mike Gammage’s blog that quoted Janelle Hill of Gartner speaking at the recent Gartner BPM Summit in London:

The right answer in selecting a BPMS is often three BPMSs, based on the particular projects’ needs.

I commented that this seemed to indicate that Gartner is bowing to pressure from platform vendors that have multiple fragmented BPM offerings (e.g., IBM), and that it’s not a good thing for customers.

Just before midnight that night, I received a reply from someone who I met at a conference last year:

<begin rant>

Regarding your links today – and the Sourcing Shangri-La post featuring the Janelle Hill/Gartner quote :  "The right answer in selecting a BPMS is often three BPMSs, based on the particular projects’ needs." 

Couldn’t agree with you more on how disappointing this is.  This is a very unfortunate message that I seem to be hearing more and more lately.  For those of us out there getting muddy in the trenches, who use and implement a BPMS for business processes executed by [humans] that have [document] and line of business system [integration] inputs and outputs required for most activities within a single business process, this "three different BPMSs " reasoning doesn’t make any sense at all.  It does make a convenient pitch, however, if you’re a vendor trying to explain why you’ve acquired products that overlap in a confusing way and perhaps don’t want to lay out the money to integrate them.   Maybe I’m missing something, but I’m a little stunned that it seems to be so widely accepted. 

As long as vendors (and research VPs) continue to put this out there, the vendors (like Pega) who would never punish their end users or application support teams in a single organization with three different BPM suites to deal with will continue to see results like this (in a severe recession, no less):

“Feb. 22, 2010 – Pegasystems Inc. (NASDAQ: PEGA), the leader in Business Process Management (BPM) software solutions, today announced financial results for the year and fourth quarter ended December 31, 2009. Revenue for 2009 increased 25% to $264 million compared to 2008. Net income for 2009 nearly tripled and increased to $32.2 million.” (http://money.cnn.com/news/newsfeeds/articles/marketwire/0589312.htm)

<end rant/>

Couldn’t have said it better myself.

Progress Analyst Day Wrapup

I just found the last of my Progress analyst day notes from last week, scrawled in a paper notebook (which is why I usually write directly to keyboard at conferences). These were from one-on-one meetings that I had with John Bates and Dr. Ketabchi after the end of the formal presentations, where I had a chance to ask about product directions.

It’s probably good to do some writing after the fact, when I’ve had time to reflect a bit, review the presentation slides, and read posts by other attendees such as John Rymer [link fixed], who sums up Progress’ mission, customer case studies and product positioning. I particularly like his description of the two new suites that Progress is offering:

Enterprise Business Solutions tracks existing transactions and services interactions to discover and verify implicit business processes, defines, senses, and responds to real-time events, automates business process flows, and provides SOA infrastructure. Core to this business unit is a new suite that brings together Progress Actional, Apama, and newly acquired Savvion. Think of the new Responsive Process Management Suite as BPM and transactional systems wrapped in real-time event management.

Enterprise Data Services maps primary information sources into a new real-time model managed by DataXtend Semantic Integrator, including integration, aggregation, data delivery, and ultimately, analysis.

To sum up my discussions with Bates and Ketabchi (these were separate, but covered related topics, so I’ve combined them) on what’s happening with the products, particularly the integration of Savvion into the Responsive Process Management suite:

  • The first version of the Control Tower monitoring application is ready, or nearly so. This is based on the Savvion process monitoring portal (which already allowed for external data sources), and constitutes the primary piece of integration between the products.
  • The existing event-handling structure in Savvion will be used to feed events from Apama. Although there will be some tightening of this integration, there are no major changes required to make this happen.
  • Currently, the modeling for CEP (Apama) and BPM (Savvion) are separate tools. However, they are both Eclipse-based, so it’s likely that they will be combined in some way and given a consistent look and feel, even if only as separate tabs within the same modeling environment. Since they both have business-facing perspectives using graphical models, this makes sense.
  • Savvion’s current event processing capabilities – the only overlap in the Savvion and Progress product portfolios prior to the acquisition – will eventually be replaced by Apama, which will have an impact on Savvion customers who use that functionality. There is no plan for an immediate rip-and-replace, and the Savvion EP will be supported for some time, but customers should start thinking about migration.

Progress RPM with product names

I asked about runtime collaboration within the products, but was not left with a clear picture of the future for Progress products here. Currently, Apama supports some threshold type of changes, and Savvion allows reassigning a task to another user but not changing the process model, which seems to represent a bare minimum in this emerging functional requirement.

You can find all of my coverage of the Progress Software Analyst Day here.

BPM Conferences Start To Come Out Of Hiding

2009 was not a stellar year for BPM conferences: many vendors cancelled or moved to an online format, and even Gartner decided that two North American conferences per year is too much. Although many organizations budgets are still tight, conference organizers are betting on a bit more available travel and education budget being available this year.

I just saw a post about Leonardo Process Days coming up in July in Sydney, and added it to the BPM events calendar that I maintain here, as I do with most other BPM-related events that I hear about. If you have an event that you want added, let me know; if you want to add a lot of events, then I can make you a contributor to the calendar. If you use Google Calendar and want to add this to the list of “Other calendars” that you can overlay on your own calendar, there’s a button at the bottom right of the calendar that will do that.

Paper on Runtime Collaboration and Dynamic Modeling in BPM

I recently wrote a paper for the February Cutter IT Journal called Runtime Collaboration and Dynamic Modeling in BPM: Allowing the Business to Shape Its Own Processes on the Fly. It’s available on the web to Cutter subscribers, and in the printed journal.

In the article, I deal purely with the topic of runtime collaboration, not collaboration during process modeling: how users participating in a process can add new participants for the purposes of collaborating on a step in a structured process, or even create their own subprocess at that step. I look at why you would want to do that (mostly auditability of processes) and how the results of that can be rolled back into process design rather than just being changes to a single process instance.

Disclosure: my payment for writing this paper was a year’s subscription to the journal, plus bragging rights.

Dr. Ketabchi: A Shared Vision With Progress and Savvion

Dr. K. took the stage to tell us about the planned integration between the existing Progress products and Savvion, starting with a discussion of Savvion’s event-driven human-centric beginnings, model-driven development and solution accelerators. The new Progress RPM (responsive process management) suite has Savvion’s BPM at its core, combining their BPM and BRM strengths with CEP and information management. A challenge for Progress – and any other BPM vendor – is that less than 5% of enterprises’ processes run on a BPMS, and although dramatic improvements could be made to 80% or more of enterprise processes, most enterprises find it too difficult and costly to implement a BPMS in order to make these end-to-end improvements. It’s Progress’ intention that RPM overcome some of this resistance by extending visibility of business events to business managers, and provide the ability to respond in order to control business and ultimately increase revenues.

He was joined by Sandeep Phanasgaonkar of Reliance Capital, who have a large and successful Savvion implementation. Phanasgaonkar was responsible for the Savvion implementation at a huge outsourcing firm prior to his time at Reliance, where they automated and standardized their processes in the course of improving those processes. When he moved to Reliance during their expansion into their multiple financial products and channels, he saw the potential for process improvement with a BPMS, did a vendor comparison, and again selected Savvion for their processes. They use Savvion as the glue for orchestrating multiple legacy financial systems, Documentum content management, low-level WebSphere messaging processes and other systems into a fully integrated set of business processes and data.

Reliance has no other Progress products besides Savvion, but they see the importance of managing business events and processes as a cohesive whole, not as two separate streams of activity. This will allow them to detect degradation in processes due to seasonal or other fluctuations, and address the problems before they fully manifest.

John Bates, CTO of Progress

John Bates started with more of the Progress message on operational responsiveness, highlighting the importance of process and event management in this. He showed survey results stating that companies find it critical to respond to problematic events in real time, but only a small percentage are able to actually do that. Companies want real-time business visibility, the ability to immediately sense and respond, and continuous business process improvement in a cycle of responsive process management. Yeah, and I want a pony for Christmas. Okay, not really, but wishing doesn’t make any of this happen.

By adding BPM to their suite, Progress brings together process and event management; this makes is possible to achieve this level of operational responsiveness, but it’s not quite so easy as that. First of all, we need to hear more about how the suite of products are going to be integrated. Secondly, and more importantly, companies who want to have this level of operational responsiveness need to do something about the legacy sludge that’s keeping them from achieving it: otherwise, Progress (and all the other software vendors) are just pushing on a rope.

Bates then called up James Hardy, CIO at State Street Global Markets Technology, for an on-stage conversation about how State Street is using the Progress Apama CEP product in trading and other applications. They’re a Lean Six Sigma shop, and see CEP as a natural fit for the type of process improvement that they’re doing in the context of their LSS efforts: CEP allows for some exceptions to be corrected and resubmitted automatically rather than being pushed to human exception management. They’re also committed to cloud-based technology, but by building a private cloud, not public infrastructure, and have seen some speedy implementations due to that. They see operational responsiveness as not just about increasing revenue, but also about mitigating risk.

Bates then talked about 3Italia, an Italian telco that was having trouble dealing with the incremental credit checks and revenue generation required for their prepaid mobile customers: since their billing systems weren’t fully integrated with their servicing systems, they sometimes allowed calls to be completed even though a customer had run out of credit and their credit couldn’t be revalidated. They are also a TIBCO enterprise customer, but weren’t able to get the level of agility that they needed, so implemented Progress (this is Progress’ version of story, remember). They managed to stop most of that revenue leakage by providing direct links between billing and servicing systems, and also started doing location-based advertizing to increase their revenues.

He also spoke about Royal Dirkzwager, a shipping line, and how they were able to achieve millions in fuel savings by detecting potential issues with docking and loading before they occured, and avoid burning fuel getting to the wrong place at the wrong time.

He finished up the case studies with a couple of airline scenarios for maximizing profits using situational awareness: responding to crew or flight delays proactively rather than just responding to irate customers after the fact (this is a lesson that Lufthansa could definitely learn, based on my recent experience). To bolster this case, he introduced Joshua Norrid of Southwest Airlines – also a TIBCO customer – who discussed their journey from “Noah’s Architecture” (two of everything) to focusing on strategic products and vendor partners. They were an IONA customer, then Savvion, and recently started using Actional: having lived through two of the products that he used being acquired by Progress, he said that the acquisitions where done “in style”, which is pretty high praise considering the usual experience of customers of acquired companies. They’ve started to look at how they can be more operationally responsive: text messages when flights are delayed, for example, but also looking forward to how flight bookings might change during a weather event, or how local hotels might be pre-booked in the case of significant expected delays. They see reducing redundancies and inefficiencies in their architecture as a key to their success: lowered cost and better data integration helps in bottom line IT cost savings, operational savings and customer satisfaction.

After the customer stories, Bates discussed the future of responsive business applications: packaged applications evolving into dynamic applications; a control tower for business users to model, monitor, control and improve dynamic applications; and solution accelerators for pre-built industry-specific dynamic applications. Savvion’s strong focus on pre-built applications is an important synergy with the rest of the Progress suite. Their solution map includes these accelerators supported by a single control tower, which in turn provides access to BPM, CEP and other technology components. For example, their Responsive Process Management (RPM) Suite includes Actional, Apama and Savvion underpinned by Sonic, DataDirect Shadow and Enterprise Data Services, plus the common Control Tower and three vertical accelerator applications for finance, telecom and travel/logistics. They believe that they can continue to compete in their specialty areas such as CEP and BPM, but also as an integrated product suite.

RPM technical won’t be publicly announced until March 15th, but it’s already all over Twitter from the people in the room here in Boston.

Lean Sigma Tools Applied to BPM

Chris Rocke and Jane Long from Whirlpool presented on their experiences with integrating LSS tools into BPM practices to move beyond traditional process mapping. Whirlpool is a mature Six Sigma company: starting in their manufacturing areas, it has spread to all other functions, and they’ve insourced their own training certification program. Six Sigma is not tracked as separate cost/benefit within a project, but is an inherent part of the way every project is done.

They introduced BPM during to a large-scale overhaul of their systems, processes and practices; their use of BPM is includes process modeling and monitoring, but not explicit process automation with a BPMS outside of their existing financial and ERP systems. However, they are creating a process-centric culture that does manage business processes in the governance and management sense, if not the automation sense in all cases. They brought LSS tools to their BPM efforts, such as process failure mode and effects analysis (PFMEA), data sampling and structure methods, thought maps and control charts; these provide more rigorous analysis than is often done within BPM projects.

Looking at their dashboards, they had the same problem as Johnson & Johnson: lots of data but no consistent and actionable information. They developed some standard KPIs, visualized in a suite of seven dashboards, with alert when certain control points are exceeded. Their Six Sigma analytics are embedded within the dashboards, not explicit, so that the business owners view and click through the dashboards in their own terms. The items included in the dashboard are fairly dynamic: for example, in the shipping dashboard, the products that vary widely from expected and historic values are brought forward, while those that are within normal operating parameters may not even appear. Obviously, building the models underlying this was a big part of the work in creating the dashboards: for example, shipping dashboard alerts are based on year-over-year differences (because sales of most products are seasonal) with control limits that are the mean of the YOY differences +/-  two standard deviations for a yellow alert, or three standard deviations for a red alert, plus other factors such as checking to see if the previous year’s value was an anomaly, weighted by the number of units shipped and a few other things thrown in.

The analytical calculations behind a dashboard might include internal forecasts or market/industry values, include seasonal fluctuations or not, depending on the particular measurement. The dashboard visuals, however, conceal all the complications of the underlying model. Alerts aren’t necessarily bad, but indicate a data point that’s outside the expected range and warrants investigation or explanation. They’ve seen some success in reducing variability and therefore making their forecasts more accurate: preventing rather than detecting defects.

They’re also using SAP’s Xcelsius for the dashboard itself; that’s the third company that I’ve heard here that is using that, which is likely due in part to the large number of SAP users but also gives credit to the flexibility and ease of use of that tool. They’re using SAP’s Business Warehouse for housing the data, which extracts from their core ERP system nightly: considerably more up-to-date than some of the others that we’ve seen here, which rely on monthly extracts manipulated in Excel. Although IT was involved in creating and maintaining BW, the LSS team owns their own use of Xcelsius, which allows them to modify the dashboards quickly.

Using Dashboards to Run the Business and Focus Improvements

David Haigh of Johnson & Johnson presented on how they’re using dashboards in their process improvement efforts; this is much further into my comfort zone, since dashboards are an integral part of any BPM implementation. He’s part of the consumer products division rather than pharmaceutical or medical: lots of name brands that we all see and use every day.

Their process excellence program covers a range of methods and tools, but today’s talk was focused on dashboards as a visualization of a management system for your business: to set strategy, track progress, and make corrections. Like many companies, J&J has a lot of data but not very much that has been transformed into actionable information. He makes an automotive analogy: a car engine typically has 43 inputs and 35 outputs, but we drive using a dashboard that has that information rolled up into a few key indicators: speed, RPM, temperature and so on.

They see dashboards as being used for governing the company, but also for informing the company, which means that the dashboards are visible to all employees so that they understand how the company is doing, and how their job fits into the overall goals and performance. Dashboards can – and should – leverage existing reporting, especially automated reporting, in order to reduce the incremental work required to create them. They have to be specific, relating jobs to results, and relevant in terms of individual compensation metrics. They have dashboards with different of levels of details, for different audiences: real-time detailed cockpits, medium-level dashboards, and reports for when a repeatable question can’t be answered from a dashboard within three clicks (great idea for deciding when to use a dashboard versus a report, btw). They used a fairly standard, slightly waterfall-y method for developing their dashboards, although did their first rollout in about 3 months with the idea that the dashboards would be customizable to suit changing requirements. One challenge is their wide variety of data sources and the need for data manipulation and transformation before reporting and feeding into dashboards.

They had most of their reports in Excel already, and added SAP’s Xcelsius to generate dashboards from those Excel reports. That provided them with a lot of flexibility in visualization without having to rewrite their entire ETL and reporting structure (I know, export to Excel isn’t the best ETL, but if it’s already there, use it).

One of the big benefits is the cross-departmental transparency: sales and logistics can see what’s happening in each others areas, and understand how their operations interrelate. This highlights their non-traditional approach to dashboard visibility: instead of just having management view the dashboards, as happens in most companies, they expose relevant parts of the dashboard to all employees in order to bring everyone into the conversation. They actually have it on monitors in their cafeteria, as well as on the intranet. I love this approach, because I’m a big believer in the benefits of transparency within organizations: better-informed people make better decisions, and are happier in their work environment. They’re able to weave the dashboards into their process improvements and how they engage with employees in running the business: being able to show why certain decisions were made, or the impact of decisions on performance.

Their next steps are to review and improve the metrics that they collect and display, and to start involving IT to automate more of the data collection by pushing information directly to Cognos rather than Excel. There were a ton of questions from the audience on this; some are using dashboards, but many are not, and are interested in how this can help them. I’m interested in how they plan to push the dashboard results beyond just human consumption and into triggering other automated processes through event processing, but I’ll have to catch David offline for that conversation.