
A few weeks ago, I had the chance to see Fujitsu’s new process discovery product/service in action. Unlike the usual sort of process discovery, which involves business analysts running around and documenting what people are doing, this automates the discovery of business processes by examining logs of existing applications.
The problem with the manual process discovery — based on observation, interview and operations/procedures manuals — is that it’s very labor-intensive, and can produce inaccurate results. The inaccuracies can be due to the level of experience of the business analysts, as well as what Michael zur Muehlen refers to as “process confabulation”: when you ask someone about what they do and they don’t have a good answer, they’re just as likely to make something up as they are to admit that they don’t know. I’ve seen this a lot, and tend to base most of what I do in process discovery on observation rather than interviews so that I can see the actual process; my ears perk up when I hear “well, we’re supposed to do it this way, but this is what we actually do”.
In a lot of cases, information about the business processes that are actually executed is embodied within existing enterprise applications, and saved to databases and log files. These could be supply chain, ERP, databases, legacy transactional systems or any other system that records events in some fashion. It is possible to install measurement tools on these systems to track what’s happening, or modify these systems to emit events, but Fujitsu’s new process discovery product/service extracts events from existing database and logs without modifications to existing systems. The real magic, however, comes in the software that Fujitsu has created to visualize those events in the context of a business process, and separate the “happy path” from the exceptions. Once that’s done, it’s possible to look at the ways to reduce exceptions, since the events that cause those exceptions are well understood.
I use the term “product/service” since all this manipulation and analysis requires some amount of training, and Fujitsu currently offers it as a consulting service, although there are standard software portions involved as part of that service. They have three levels of service, ranging from a basic extraction and visualization, to a more comprehensive analysis, to a customized offering. They’ve been using this with customers in Japan for some time — hence the Japanese case studies — and have recently launched their North American trial. Furthermore, it’s not specific to Fujitsu Interstage customers: this is really an independent effort of looking at your existing systems and optimizing your business processes. If that led to you buying Interstage, they’d be thrilled, but it’s not a prerequisite.
Looking at the new toys is the fun part of my job, so Keith Swenson took me for a test drive of the visualization tool. We were looking at a map of the events extracted from database logs for about 5,000 process instances, which were read into the process viewer using a standard CSV import. The straight-through path is detected and shown — in this case, it came from 632 process instances — but a slider control allowed us to change the threshold and add in more of the instances, up to 100% (which showed a pretty complex mess of a process).


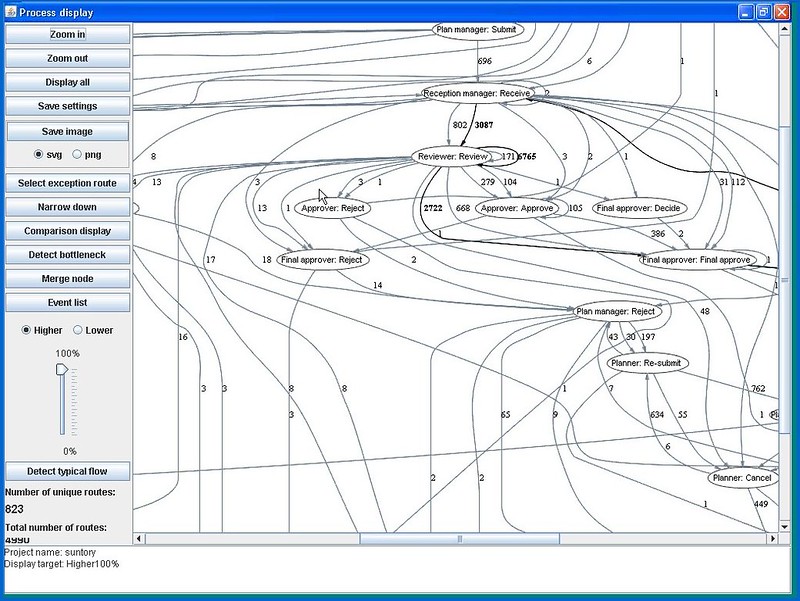
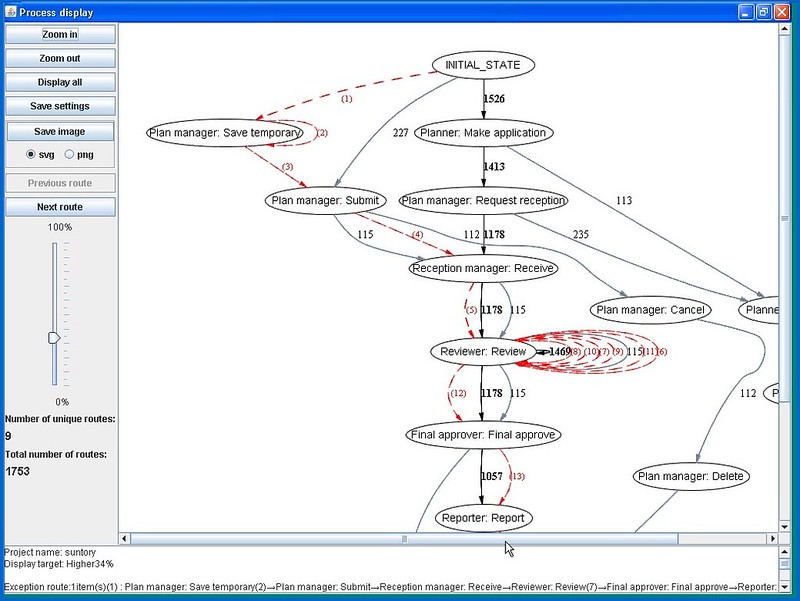
That’s a pretty cool visualization, since the exception paths appear dynamically as the slider moves, but you really want to pick a simple baseline version of the process using the slider control — not the trimmed-down straight-through path, but one that includes the most common routes — then select one or more exception paths to overlay on it. Exception paths can be sorted and filtered for selection, using criteria including frequency, deviation, repetition, backtracks, and specific transitions.
Visually, the straight-through path shows as a thick black line, the alternative routes as gray lines, and the selected exception paths are in red. Although the number beside the black lines indicate the number of process instances that traveled that path, we figured out that the number beside the red (exception) lines indicated the step in the process sequence, since that’s more relevant when you’re tracking exceptions. Other information about transition times can also be shown, indicating bottlenecks in the process.
The tool is intended to be used interactively by a knowledgeable analyst in order to guide the views that will highlight the trouble spots: sort of like using simulation with real data. This isn’t an automated tool that takes data in one end and spits out the answers at the other; it’s meant to drive discussion and analysis, not replace it.

Keith showed me the results of three other case studies, and a couple of interesting effects of the data visualization and analysis that would make a quality manager’s heart sing:
- In a hard drive manufacturing plant, the assembly portion of the process was simple, but the pre-process and test lines were much more complex. Eliminating the exception routes to improve the process actually had the effect of improving the quality of the drives being manufactured on the line.
- In the second case, the processes of two different branch offices were compared, and it was identified that in one, half of the orders that their customers placed were for items that were not in stock, whereas the other office shipped most of their orders from their existing stock. There was no judgement about which was better, but it’s useful to be able to identify that one is using a just-in-time approach to reduce inventory costs, whereas the other is focused on reducing time to ship.
- The third case showed some time analysis of processes to see the degree of deviation in the transition time between two steps. This is a classic statistical analysis, where a larger deviation (usually) indicates a higher potential for process improvement.
Typical benefits that their customers have seen so far are to identify and optimize inefficient processes, identify exceptions and infrequent paths, visualize the gap between the expected and actual processes, identify location-specific differences, and locate process bottlenecks.
This doesn’t, of course, consider all of the purely manual processes that are not captured in system logs, but would greatly reduce the amount of work required to map out the processes that do touch these systems in some way. Furthermore, it happens with little or no time investment from business people and analysts, hence has less impact on the customer than other discovery and analysis techniques. The reality is that this would work great in combination with some skilled manual discovery; maybe Lombardi should use this as part of their process discovery service offerings 🙂
Looking at the screendumps, it almost looks as if the Fujitsu miner does not differentiate between parallel and sequential paths. In other words, two parallel activities that in two instances are handled in different order, are mapped as two different sequential paths. If so, this would indicate much more complexitiy in the process than actually is the case. But I don’t know the Fujitsu product very well.
However, I am realy convinced that process mining or process discovery is going to break through in BPM. Especially in runtime (so not only at process definition) it is the missing link between business intelligence that is often output and performance driven, and process adaptation. BI tells you what goes wrong, process mining gives you valuable indications about what in your process is causing it.
For those of you interested in automated process discovery, there is a very active research group in The Netherlands working on this subject for about 10 years now (www.processmining.org). In fact, many of the figures above could be produced using their open-source tool ProM and algorithms in there.
It is nice to see that there is an increasing interest in process discovery. Note that this is a special flavor of process mining and that one can extact much more information from today’s event logs. For example, event logs contain information on the people executing activities and this may be used to build social networks. Moreover, the issue of conformance (does the model fit reality?) is vital.
Process mining techniques allow for extracting information from event logs. For example, the audit trails of a workflow management system or the transaction logs of an enterprise resource planning system can be used to discover models describing processes, organizations, and products. Moreover, it is possible to use process mining to monitor deviations (e.g., comparing the observed events with predefined models or business rules in the context of SOX).
Process mining is closely related to BAM (Business Activity Monitoring), BOM (Business Operations Management), BPI (Business Process Intelligence), and data/workflow mining. Unlike classical data mining techniques the focus is on processes and questions that transcend the simple performance-related queries supported by tools such as Business Objects, Cognos BI, and Hyperion.
The feature Fujitsu announced as “the world’s first automated busines process discovery and visualization service” (http://www.computers.us.fujitsu.com/www/newsdetail.shtml?nf=08390785.nitf) is already available on the market as a product for 7 years. It is a fully grown up product called ARIS Process Performance Manger (PPM) from IDS Scheer.
From its first version back in 2001 on until the current release 4.1, PPM automatically rebuilds any business process and doing that instance by instance, because every case can differ by its process flow from another. PPM can also aggregate any number of process instances and reveal repeatedly occuring process defects such as loop backs. Such deviations from the process standard are the potential for a coninuous business process improvement.
All of that process discovery (we rather call it Process Intelligence) is based on runtime data either extracted or delivered from the IT systems supporting the process execution.
And of ocurse, there is no manual process drawing needed at all, although PPM’s output is by default the industry standard for graphical process models EPC (event-driven process chain), which represents the business process flow at best.
I just ignore qualifiers like “the world’s first” and “the leading provider of” in any vendor information, since it’s just PR spin.
Regardless, I believe that what Fujitsu is doing is different from ARIS PPM — my understanding is that PPM requires some sort of adapter to be running on the ERP or other legacy system platform in order to do process mining, whereas Fujitsu is working passively from the system logs. I haven’t seen how process mining information is presented in ARIS PPM, so can’t comment on how comparable these are.
ARIS PPM is really not bad. And the visualization uses the ARIS eEPC (Event Driven Process Chain). Both kinds of visualization (Fujitsu Process Discovery and ARIS PPM) are not really easy to read, but the ARIS one seems to be more systematic for me.
But the main point is, that visualization is not the BIG benefit of such a tool. “Reverse Modeling” as I want to call it is just a side effect.
The BIG win for me is the possibility to measure the process performance continuously with such a tool. But then the manual parts of the process (e.g. calculate payroll cost, plan ressource allocation…) are most important and not the IT supported parts.
These tools must enable you to add these manual activities, otherwise the benefit is low.
I agree that qualifiers like “the world’s first” and “the leading provider of” in any vendor information should not be taken too seriously. However, it is not good if good ideas get killed because vendors are selling fake solutions.
In this context I would like to comment on Rune’s claim that ARIAS PPM is able to do this for 7 years. PPM is not able to do true process discovery! Instead PPM glues process fragments together that have been modeled before. There is always the need to use a dedicated adapter which assumes processes to have a certain structure or the processes need to be modeled by the ARIS designer. At run-time models are created by combining instance information and predefined models. Therefore, ARIS PPM cannot discover what has not been modeled before!
Yet there are many process mining techniques and tools such as ProM around that can actually discover processes without a-priori modeling. See http://www.processmining.org for more information.
Looks like Sandy got a hearty meal from Fujitsu! This technology has existed for more than 7 years. And Sandy thinks this is pioneering invention of Fujitsu’s.
Alex, I don’t think that the underlying technology is pioneered by Fujitsu, but I find their visualization and productization of it to be unique.
btw, you should be more clear with your insults: I can’t tell if you’re calling me stupid or corrupt. 🙂
The really cool part of what Fujitsu is doing is introducing their ADP tool early in the blueprinting stage of their SAP implementation projects as part of their overall service to their customers. Think of it … a true before and after view of an SAP implemenatation.