
Gartner’s hype cycle for 2009 was released this week, and there was a webinar today with Jackie Fenn to walk through it. The actual diagrams are not working on their press release right now, but ReadWriteWeb is hosting their own copy of the emerging technologies hype cycle (which was in the press release originally) if you want to take a look.
Gartner has 79 different hype cycles focused on individual technologies, rolled up in this special report that is free but doesn’t contain the meat: for that, you need to click through to the hype cycle for the technology in which you’re interested and purchase that report.
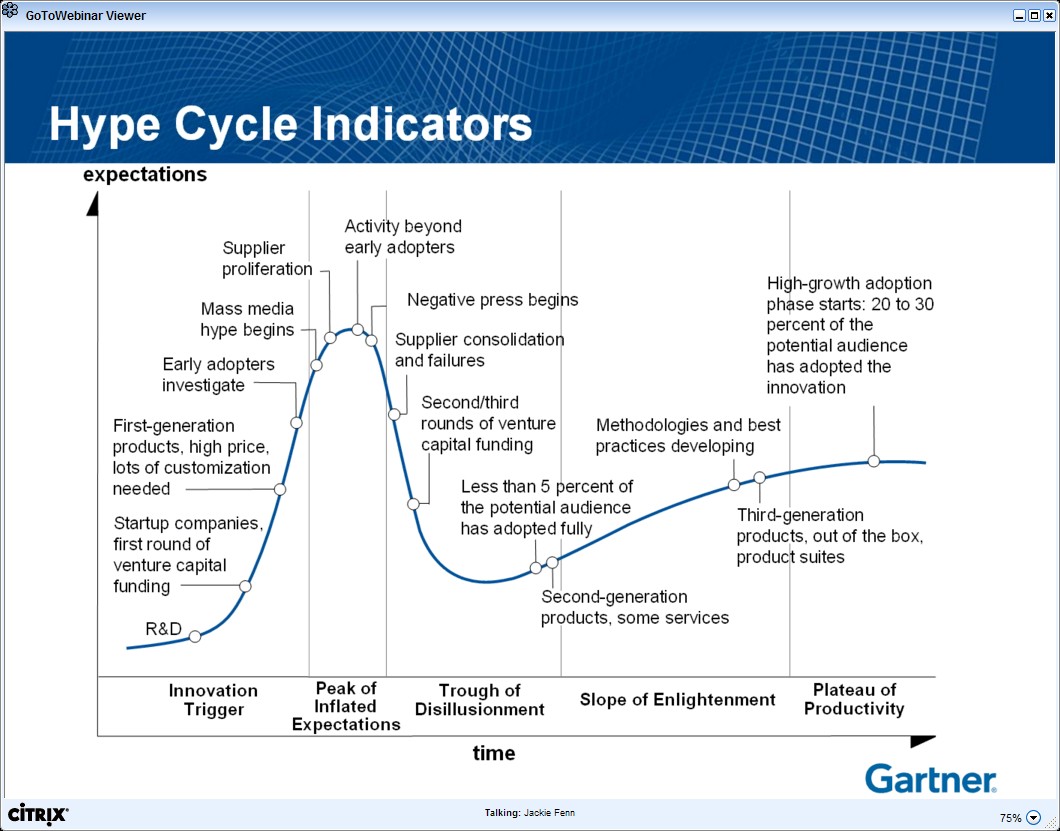
Fenn explained the concept of the hype cycle: technologies move from an innovation trigger up a steep slope of positive hype to the peak of inflated expectations, then down an equally steep slope of negative hype to the trough of disillusionment before increasing gradually along the slope of enlightenment to the plateau of productivity. She explained some of the specific indicators for each part of the cycle – which is what Gartner is analyzing to tell where on the hype cycle that a particular technology lies, along with the analysts’ subjective opinions – such as when certain rounds of venture funding kick in, and when best practices emerge. Different types of companies adopt technologies at different points in the hype cycle, depending on how conservative that they are, and how critical the particular technology is to their competitive differentiation.
By bisecting the curve at the local minimum in the trough of disillusionment, companies can ask themselves “what’s here that we could be using” for technologies to the left (considered new/cutting edge), and “what’s here that we’re not using” for those to the right (considered mainstream). There are some anomalies, such as corporate blogging and wikis already climbing the slope of enlightenment, whereas social software suites – which would likely include both of those – are just past the peak of inflated expectations.
She did a quick poll to see what technologies (from a very select subset of emerging technologies) that the attendees think will generate the most value for their organizations during the next two years, then linked the responses to where those technologies lie on the curve: not surprisingly, cloud computing topped the poll at 42%, and it’s at the peak of inflated expectations right now, where there is a proliferation of suppliers and activity beyond early adopters. Social software suites, just past the peak with negative press beginning and supplier consolidation approaching, was second at 29%.
There are several new hype cycles this year, including cloud computing, data center power and cooling, and virtualization; there are also several new technologies listed in the emerging technologies hype cycle that Fenn focused on in the webinar, such as wireless power.
Every technology on the emerging technologies hype cycle is also on a priority matrix that serves as a rough risk-benefit measure, showing the expected years to mainstream adoption (based on Gartner’s analysis of how fast that each is moving through the hype cycle) mapped against the level of expected benefits (low-moderate-high-transformational).
Gartner produced their first hype cycle in 1995, and Fenn showed the original one from back then with a few of the technologies mapped on it; some of those are still poking along, such as speech recognition that hasn’t moved much in 10 years; others, such as Bluetooth, moved through the cycle at a brisk pace and reached mainstream adoption quickly.
Gartner has published a book on Mastering the Hype Cycle: How to Choose the Right Innovation at the Right Time (Gartner), which provides a framework for understanding the hype cycle and adoption patterns that new technologies will move through, and understanding the danger zones.
Great comment by my friend Pat Hunter, who spent a number of years doing high-tech PR:
“Speaking as an experienced former hypist, I would say that this chart is accurate for the US company and US market only. If you are a Cdn or European company, you can alter these curves to your advantage with strategic hype in other markets … so you can sustain the peak across several geographic markets. We did this at Alias and Discreet, as Pat can attest. Thus our ‘trough of disillusionment’ was not as deep, since it was interrupted by multi-market ups and we sailed to second gen… then management went psycho believing our own hype and imploded. I don’t have solution for that.”
She put her comment on the Flickr photo, I just copied it here.