Getting Business Process Value From Social Networks #GartnerBPM

For the last session of the day, I attended Carol Rozwell’s presentation on social network analysis and the impact of understanding network processes. I’ll be doing a presentation at Business Rules Forum next month on social networking and BPM, so this is especially interesting even though I’ll be covering a lot of other information besides social graphs.

She started with the (by now, I hope obvious) statement that what you don’t know about your social network can, in fact, hurt you: there are a lot of stories around about how companies have and have not made good use of their social network, and the consequences of those activities.

She posited that while business process analysis tells us about the sequence of steps, what can be eliminated and where automation can help, social network analysis tells us about the intricacies of working relationships, the complexity and variability of roles, the critical people and untapped resources, and operational effectiveness. Many of us are working very differently than we were several years ago, but this isn’t just about “digital natives” entering the workforce, it’s about the changing work environment and resources available to all of us. We’re all more connected (although many Blackberry slaves don’t necessarily see this as an advantage), more visual in terms of graphical representations and multimedia, more interactively involved in content creation, and we do more multitasking in an increasingly dynamic environment. The line between work and personal life blurs, and although some people decry this, I like it: I can go to many places in the world, meet up with someone who I met through business, and enjoy some leisure time together. I have business contacts on Facebook in additional to personal friends, and I know that many business contacts read my personal blog (especially the recent foodie posts) as well as my business blog. I don’t really have a lot to hide, so don’t have problem with that level of transparency; I’m also not afraid to turn off my phone and stop checking my email if I want to get away from it all.

Your employees are already using social media, whether you allow it within your firewall or not, so you might as well suck it up and educate them on what they can and can’t say about your company on Twitter. If you’re on the employee side, then you need to embrace the fact that you’re connected, and stop publishing those embarrassing photos of yourself on Facebook even if you’re not directly connected to your boss.

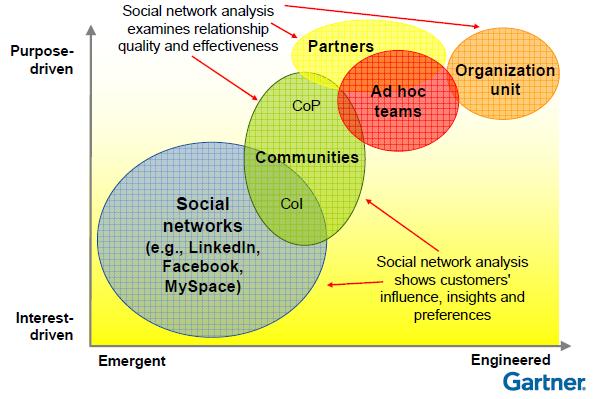
She showed a chart of social networks, with the horizontal axis ranging from emergent to engineered, and the vertical axis from interest-driven to purpose-driven. I think that she’s missing a few things here: for example, open source communities are emergent and purpose-driven, that is, at the top left of the graph, although all of her examples range roughly along the diagonal from bottom left to top right.

There are a lot of reasons for analyzing social networks, such as predicting trends and identifying new potential sources of resources, and a few different techniques for doing this:

  • Organizational network analysis (ONA), which examines the connections amongst people in groups
  • Value network analysis (VNA), which examines the relationships used to create economic value
  • Influence analysis, a type of cluster analysis that pinpoints people, associations and trends

Rozwell showed an interesting example of a company’s organizational chart, then the same players represented in an ONA. Although it’s not clear exactly what the social network is based on – presumably some sort of interpersonal interaction – it highlights issues within the company in that some people have no direct relation to their direct reports, and one person who was low in the organizational chart was a key linkage between different departments and people.

She showed an example of VNA, where the linkages between a retailer, distributor, manufacturer and contract manufacturer where shown: orders, movements of goods, and payments. This allows the exchanges of value, whether tangible or intangible, to be highlighted and analyzed.

Her influence analysis example discussed the people who monitor social media – either within a company or their PR agency – to analyze the contributors, determine which are relevant and credible, and use that to drive engagement with the social media contributors. I get a few emails per day from people who start with “I read your blog and think that you should talk to my customer about their new BPM widget”, so I know that there are a lot of these around.

There are some basic features that you look for when doing network analysis: central connectors (those people in the middle of a cluster), peripheral players (connected to only one or two others), and brokers (people who form the connection between two clusters).

There are some pretty significant differences between ONA, VNA and business process analysis, although there are some clear linkages: VNA could have a direct impact on understanding the business process flows, while ONA could help to inform the roles and responsibilities. She discussed a case study of a company that did a business process analysis and an ONA, and used the ONA on the redesigned process in order to redesign roles to reduce variability, identify roles most impacted by automation, and expose critical vendor relationships.

Determining how to measure a social network can be a challenge: one telecom company used records of voice calls, SMS and other person-to-person communications in order to develop marketing campaigns and pricing strategies. That sounds like a complete invasion of privacy to me, but we’ve come to expect that from our telecom providers.

The example of using social networks to find potential resources is something that a lot of large professional services firms are testing out: she showed an example that looked vaguely familiar where employees indicated their expertise and interests, and other employees could look for others with specific sets of skills. I know that IBM does some of this with their internal Beehive system, and I saw a presentation on this at the last Enterprise 2.0 conference.

There are also a lot of examples of how companies use social networks to engage their customers, and a “community manager” position has been created at many organizations to help manage those relationships. There are a lot of ways to do this poorly – such as blasting advertising to your community – but plenty of ways to make it work for you. Once things get rolling in such a public social network, the same sort of social network analysis techniques can be applied in order to find the key people in your social network, even if they don’t work for you, and even if they primarily take an observer role.

Tons of interesting stuff here, and I have a lot of ideas of how this impacts BPM – but you’ll have to come to Business Rules Forum to hear about that.

Fujitsu process discovery case study #GartnerBPM

I first saw Fujitsu’s process discovery offering last year, and it looked pretty useful at the time, but it didn’t have much of a track record yet. Today’s session brought forward Greg Mueller of Electro Scientific Industries (ESI), a manufacturer of photonic and laser systems for microengineering applications, to talk about their successes with it.

Basically, the Automated Process Discovery (APD) uses log files and similar artifacts from any variety of systems in order to derive a process model, analyzing frequencies of process variations, and slicing and dicing the data based on any of the contributing parameters. I’ve written a lot about why you would want to do process discovery, including some of the new research that I saw at BPM 2009 in Germany last month.

ESI wanted to reduce inventory and improve manufacturing cycle time, and needed to understand their opportunity-to-order process better in order to do that. They used APD to determine the actual process flows based on about 15 months of data from SAP and other systems, then validated those flows with the team who worked with those flows. They wanted to look at variations based on business unit and other factors to figure out what was causing some of their cycle time and inventory problems.

They assumed a relatively simple four-step process of opportunity-quote-order-shipment, possibly with 3-4 additional steps to allow revisions at each of these steps; what they actually found when they looked at about 11,500 process instances is that they had over 1,300 unique process flows. Yikes. Some of this was cycling through steps such as order change: you would expect an order to be changed, but not 120 times as they found in some of their instances. There were also loopbacks from order to quote, each of these representing wasted employee time and increased cycle time. They found that one task took an average of 58 days to complete, with a standard deviation of 68 days – again, a sign of a process out of control. They realize that they’re never going to get it down to 25 unique process flows, but they are aiming for something far lower than 1,300.

They did a lot of data slicing and analysis: by product, by region, by sales manager and many other factors. APD allows for that sort of analysis pretty easily (from what I saw last year), much like any sort of dimensional modeling that you would do in a data warehouse.

They observed that less than 20% of their opportunities followed the happy path, and the rest were taking too long, duplicating efforts, having too many rework loopbacks, and sometimes not even shipping after a great deal of up-front work.

In their process improvement phase, they established 22 projects including a number of improvement features such as automating processes to reduce repeated steps, improving entry flow to reduce time intervals, require the entry of initial data early in the process in order to reduce loopbacks and rework. Since their business runs on SAP, a lot of this was implemented there (which begs the question of who did such a crappy SAP implementation for them in the first place such that they had problems like this – seriously, insufficient required data entry at the start of an process?), and they’re able to keep extracting and analyzing the logs from there in order to see what level of improvement that they are experiencing.

After a much too short presentation by ESI, Ivar Alexander from Fujitsu gave us a demo of APD with ESI’s basic process; I’ve seen a demo before, but it’s still fascinating so see how the system correlates data and extracts the process flows, then performs detailed dimensional analysis on the data. All of this is done without having to do a lot of interviews of knowledge workers, so is non-invasive both from a people and system standpoint.

It’s important to recognize that since APD is using the system logs to generate the process flows, only process steps that have some sort of system touch-point will be recorded: purely manual process steps will not. Ultimately, although they can make big improvements to their SAP-based processes based on the analysis through APD, they will probably need to combine this with some manual analysis of off-system process steps in order to fully optimize their operations.

Dynamic BPM versus agility #GartnerBPM

Jim Sinur led a session this morning on dynamic BPM and how to deal with the demands for change. He started with the statement that dynamic BPM is more than just another type of BPM technology, it’s a requirement for a transformational advantage, and took a look at how BPM will become more dynamic in the future.

Change is driven by unexpected exceptions in processes, and patterns of these unexpected events can indicate trends in your business environment that the processes need to accommodate. Typical change cycles in IT, however, tend to be slow and steady, which doesn’t at all match either the business dynamics or the external forces that shape them. Being able to handle these spiky demands drives the requirement for more dynamism in how processes and rules are managed, and drives the requirement for the business to be able to manage these directly rather than having to engage IT for all changes.

Gartner’s definition of dynamic BPM is the ability to support process change by any role, at any time, with very low latency. Change agents include everyone from customers and business people through business and process analysts, and on to architects and developers; if the people at the business end of this spectrum aren’t allowed to make process changes, then they’ll just work around it and invent their own processes using their own tools. This isn’t just about each individual’s personal preferences for how they work, however: if knowledge workers can make changes to their processes, they will tend to make them more efficient and effective, which has enterprise benefits.

A significant part of this is the inclusion of explicit rules within processes, so that scenario-driven rule sets can detect and respond to conditions, even without the process participants having to make those changes themselves: the basis of what James Taylor was saying in his presentation this morning. What used to be monolithic lumps of code can be split into several parts, each of which has the potential to be agile: user interface is managed by portals and the web; decision points are handled by rules engines; paths of execution are managed by BPMS; and data definitions are handled in databases or XML data representations. All of those parts used to be under the control of the developers, but turning it inside out and using more agile technologies allows people to customize their UI, change their rules on a daily basis, modify their processes, and define their own data structures. Dynamic BPM isn’t just about changing process models, it spans requirements, recompilation, data binding, loading and versioning.

There was quite a bit about services composition environments and CEP that I felt didn’t really belong in a presentation on dynamic BPM: yes, you need to have services and CEP in order to build agile processes in the first place, but it seems like filler.

One brief slide on “Web 2.0”, really just a quick laundry list of enterprise social software aspects that could impact BPM, including collaborative process design and execution, but no meat. Sinur merely read the list and pointed out that there are vendors at the showcase showing some of these capabilities. That was a bit of a disappointment, considering that the term “dynamic BPM” is being used by many (including Forrester and several vendors) to describe collaborative processes that are created or modified at runtime by the user.

He finished up with some sensible advice about separating rules and other application components from the processes in order to push towards more agile processes, although not different from the message that we’ve been hearing for quite a while now.

This wasn’t a new presentation: it was mostly recycled material that I had seen in previous Gartner presentations (either at conferences or on webinars) about agile BPM using rules, services and complex event processing. There’s been some new verbiage put around it and a few new slides, but only the briefest nod to the type of user-created ad hoc collaborative processes that represent the most dynamic form of BPM.

The five dysfunctions of a team #GartnerBPM

Jeff Gibson of the Table Group gave the morning keynote based on some of the concepts in his colleague’s book, The Five Dysfunctions of a Team: A Leadership Fable.

He started with the idea that there are two requirements for a company’s success: it has to be smart (strategy, marketing, finance, technology) and it has to be healthy (minimal politics, minimal confusion, high morale, high productivity, low turnover). Although a lot of management courses are focused on the smart side, the healthy side is a multiplier of the smart side, boosting the success far beyond what you can do by being smart alone.

He then moved on to the five dysfunctions of a team:

  1. Absence of trust, specifically personal trust and exposing vulnerability to other team members. The role of the leader is to go first in order to show that it’s okay to make mistakes.
  2. Fear of conflict, which can lead to misunderstandings because people don’t speak their mind. The role of the leader is to search out conflict amongst team members, draw out the issues and wrestle with them.
  3. Lack of commitment, particularly to tough decisions. The role of the leader is to force clarity and closure on those decisions to ensure that everyone is committed to upholding them.
  4. Avoidance of accountability. The role of the leader is to confront difficult issues, such as problematic team behaviors.
  5. Inattention to results. The role of the leader is to focus on collective outcomes, not allowing a “superstar” on the team to make themselves look good to the detriment of the team result.

Usually I find these external keynotes that are unrelated to the conference subject to be so-so, but I really enjoyed this one, and could have used this advice when I was heading up a 40-person company. I’ll be checking out the book.

Advanced decisioning #GartnerBPM

I managed to get out of bed and down to the conference in time for James Taylor’s 7am presentation on advanced decisioning. If you’ve been reading here for a while, you know that I’m a big proponent of using decisioning in the context of processes, and James sums up the reasons why: it makes your processes simpler, smarter and more agile.

Simpler: If you build all of your rules and decisioning logic within your processes – essentially turning your process map into a decision tree – then your processes will very quickly become completely unreadable. Separating decisions from the process map, allowing them to become the driver for the process or available at specific points within the process, makes the process itself simpler

More agile: If you don’t put your decisioning in your processes, then you may have written it in code, either in legacy systems or in new code that you create just to support these decisions. In other words, you tried to write your own decisioning system in some format, but probably created something that’s much harder to change than if you’re using a rules management system to build your decisions. Furthermore, decisions typically change more frequently than processes; consider a process like insurance underwriting, where the basic flow rarely changes, but the rules that are applied and the decisions made at each step may change frequently due to company policy or regulatory changes. Using decision management not only allows for easier modification of the rules and decisions, it also allows these to be changed without changing the processes. This is key, since many BPMS don’t easily allow for processes that are already in progress to be easily changed: that nice graphical process modeler that they show you will make changes to the process model for process instances created after that point, but don’t impact in-flight instances. If a decision management system is called at specific points in a process, it will use the correct version of the rules and decisions at that point in time, not the point at which the process was instantiated.

Smarter: This is where analytics comes into play, with knowledge about processes fed into the decisioning in order to make better decisions in an automated fashion. Having more information about your processes increases the likelihood that you can implement straight-through processes with no human intervention. This is not just about automating decisions based on some initial data: it’s using the analytics that you continue to gather about the processes to feed into those decisions in order to constantly improve them. In other words, apply analytics to make decisions smarter and make more automated decisions.

To wrap up James’ five core principles of decisioning:

  • Identify, separate and manage decisions
  • Use business rules to define decisions
  • Analytics to make decisions smarter
  • No answer is static
  • Decision-making is a process

He then walked through the steps to apply advanced decisioning, starting with identifying and automating the current manual decisions in the process, then applying analytics to constantly optimize those decisions.

He closed with an action plan for moving to decisioning:

  • Identify your decisions
  • Adopt decisioning technology
  • Think about decisions and processes, and how those can be managed as separate entities.

Good presentation as always – well worth getting up early.

Using BPM to survive, thrive and capitalize #GartnerBPM

Last session of the day, a panel with Jim Sinur, Elise Olding and Michele Cantara on using BPM to survive, thrive and capitalize in a turbulent economy. I realize that this session has the same title as a webinar that Cantara and Janelle Hill did a while back, and there’s a lot of repeat material from that so I won’t bother to recapture it here. There’s a link to the webinar replay in that post, and I recommend checking it out if you weren’t here in Orlando today.

Off to the vendor showcase; that’s it for day 1 of the Gartner BPM summit.

Using a center of excellence to deliver BPM #GartnerBPM

Michelle Lagna of JPMorgan Chase, a Pegasystems customer, gave a presentation on their CoE as one of the solution providers sessions. Their CoE focuses on the use of BPM tools (primarily Pegasystems) to support their 30+ active systems. It was instrumental in allowing them to break down the departmental silos within the organization, establishing standard governance models, standardizing training and contributing to reusable assets.

The CoE supports all lines of business in planning and implementing BPM initiatives:

  • Creating and maintaining architectural standards
  • Centralizing and formalizing the housing and reuse of business-configurable assets
  • Promoting standard methodologies, tools and education

They use the Agile development methodology (and promote and educate on Agile across the organization), and believe that it is instrumental to their success by reducing time to market and aligning business and IT. They’ve made a gradual transition from waterfall to Agile in order to ease into the new methodology.

They’ve developed a standard engagement model (unfortunately depicted on the presentation slide in micro-print and low contrast colors):

  • Operational walkthrough and end-to-end review, including identification of process improvements and ROI
  • Impact analysis review, identifying execution gaps and automated solutions, plus IT and business sizing
  • Project initiation training, including both BPM and Agile training
  • Application profile, high level use case requirements and reusable asset review
  • Project setup and design review, including identifying assets leveraged from other projects, functionality specifications and a design compliance review
  • Environment build-out, including generating a base framework
  • Bootstrap session, which equips the project team to complete use cases on their own
  • Direct capture of objectives to elaborate use cases, design specifications and traceability matrix; this is specifically assisted by the Pega project
  • Identification of reusable assets, then harvesting those assets and making them available for reuse by other projects

The CoE is heavily involved in the early phases, but by the time that they get halfway through the project, the project team is running on their own and the CoE is just checking in occasionally to make sure that things are proceeding as planned, and to help resolve any issues. They had to make some organizational changes to ensure that the CoE is engaged at the right time and that siloed solutions are avoided.

She presented some of the key benefits provided by the CoE:

  • Common class structure for reusability
  • Library of reusable assets with tools to track usage
  • Standardized engagement model, including a “Perfect Start” training and certification stage
  • Monthly educational webcast
  • Improved release planning process (which I’ve seen listed as a key benefit of a CoE at other customers that use other BPM products)
  • Allowing for faster changes to improve business agility

The CoE has been backed by senior executive sponsors within JPMC, which has been key to its acceptance. They are run (and funded) as a shared service, so there are normally no direct chargebacks to the projects unless the CoE team is required to be onsite for an extended period of time due to a rush or urgent situation. Interestingly, the CoE is not all co-located: there are five offshore development resources that handle harvesting the reusable assets, although they are managed from an onshore resource.

Great case study, and a lot of material that is of use regardless of which BPM product that you’re using.

Hidden costs of unstructured processes #GartnerBPM

Elise Olding and Carol Rozwell kicked off the afternoon with a session on the hidden costs of unstructured processes: although a lot of focus of BPM efforts (time and money) is on structured processes, as much as 60% of an organization’s processes are unstructured – and probably also unmonitored, unmanaged, unknown and unruly.

Gartner defines unstructured processes as “work activities that are complex, nonroutine processes, predominantly executed by an individual or group highly dependent on the interpretation and judgment of the humans doing the work for their successful completion”, and notes that most business processes are made up of both structured and unstructured processes. Unstructured processes are costing organizations a lot of money in lost productivity, lack of compliance and other factors, and you can’t afford to ignore them. Although most processes aimed to meet regulatory requirements are structured, unstructured processes provide a company’s unique identity and often its competitive differentiation, as well as supporting operational activities.

In order to start managing unstructured processes, you need to get some visibility into them; start by understanding the critical path through the process. This can be a bit tricky, since as you start to map out your unstructured processes, there will be some points at which the process participant just has to wing it and make their own decisions. These are, after all, knowledge workers, and it’s not possible (or desirable) to map every possible process permutation. Instead, map the structured portions of the process, then the points at which it becomes unstructured, but don’t try to overengineer what happens in the unstructured parts. The unstructured parts can be modeled by the notification mechanism (how someone is notified that a piece of work requires attention), the information provided to the participant to allow them to complete the unstructured work, and how the outcome is recorded.

They presented a number of analysis techniques for getting to the heart of unstructured and folklore processes:

  • Observe work being done, and challenge tasks that don’t make sense. Keep asking “why”.
  • Use storytelling (“tell me what happens when…”) to uncover decision-making logic, methods and best practices: these types of narratives are not well-captured in standard process documentation.
  • Analyze the unstructured interactions between people (e.g., customers and CSRs) and extract the themes and patterns. Rozwell wrote a report “Business Narratives Supplement Traditional Data Analysis” that discusses one technique for doing this, although it wasn’t quite clear what it was from the discussion.
  • Get clarity around roles and who is the decision-maker in any given process.

There are a variety of different areas of knowledge that you need to consider when analyzing unstructured processes, from identifying what metadata is used for collaboration, to looking at alternative analysis techniques such as mind mapping and social network analysis. Understanding collaborative technologies is also key, since unstructured processes are often collaborative in nature, and make use of the participants’ social graphs.

Their final recommendations are to keep an eye on the technologies that can support unstructured processes, but not to go overboard on monitoring and managing these processes.

Navigating the BPM Wonderland #GartnerBPM

Alan Trefler of Pegasystems gave his traditional lunch address – entertaining as always, starting with a “White Rabbit” audio clip – with an Alice in Wonderland theme of how we have to chase our business goals down whatever rabbit hole that they disappear down. Continuing on the theme, he contrasted the “one pill makes you larger” end of the spectrum with monolithic applications, and the “one pill makes you small” end of point solutions, and how you need to look at something in the middle. Don’t be afraid to ask for advice (even from hookah-smoking caterpillars), watch for those delusional Mad Hatter software salespeople, and be sure to meet the needs of the Red Queen boss lady so that you don’t get your head chopped off in the process.

Trefler is a former chess champion, so it’s inevitable that he introduced an Alice-themed chess analogy when examining his recommended steps for implementing BPM:

  • Directly capture objectives, so that your BPM implementation is focused on business intents and goals.
  • Automate the programming: the computer can write code much better than human beings, which is much less expensive in the long run even if off-shoring development appears to make it cheaper up front. In other words, use a system that allows for model-driven development and zero-code (or near-zero-code) deployment.
  • Automate the work wherever steps can be automated.

I love the term that he introduced: “heritage systems”, which are just legacy systems that we like a little bit better, probably because we’ve wrapped them to allow them to be more easily integrated with other systems and processes.

Deciding on process modeling tools #GartnerBPM

Bill Rosser presented a decision framework for identifying when to use BPA (business process analysis), EA (enterprise architecture) and BPM modeling tools for modeling processes: all of them can model processes, but which should be used when?

It’s first necessary to understand why you’re modeling your processes, and the requirements for the model: these could be related to quality, project validation, process implementation, as part of a larger enterprise architecture modeling effort and many other reasons. In the land of BPM, we tend to focus on modeling for process implementation because of the heavy focus on model-driven development in BPMS, hence model within our BPMS, but many organizations have other process modeling needs that are not directly related to execution in a BPMS. Much of this goes back to EA modeling, where several levels of process modeling that occur in order to fulfill a number of different requirements: they’re all typically in one column of the EA framework (column 2 in Zachman, hence the name of this blog), but stretch across multiple rows of the framework such as conceptual, logical and implementation.

Different types and levels of process models are used for different purposes, and different tools may be used to create those models. He showed a very high-level business anchor model that shows business context, a conceptual process topology model, a logical process model showing tasks within swimlanes, and a process implementation model that looked very similar to the conceptual model but included more implementation details.

As I’ve said before, introspection breeds change, and Rosser pointed out that the act of process modeling reaps large benefits in process improvement since the process managers and participants can now see and understand the entire process (probably for the first time), and identify problem areas. This premise is what’s behind many process modeling initiatives within organizations: they don’t plan to build executable processes in a BPMS, but model their processes in order to understand and improve the manual processes.

Process modeling tools can come in a number of different guises: BPA tools, which are about process analysis; EA tools, which are about processes in the larger architectural context; BPM tools, which are about process execution; and process discovery tools, which are about process mining. They all model processes, but they provide very different functionality around that process model, and are used for different purposes. The key problem is that there’s a lot of overlap between BPA, EA and BPM process modeling tools, making it more difficult to pick the right kind of tool for the job. EA tools often have the widest scope of modeling and analysis capabilities, but don’t do execution and tend to be more complex to use.

He finished by matching up process modeling tools with BPM maturity levels:

  • Level 1, acknowledging operational inefficiencies: simple process drawing tools, such as Visio
  • Level 2, process aware: BPA, EA and process discovery tools for consistent process analysis and definition of process measurement
  • Levels 3 and 4, process control and automation: BPMS and BAM/BI tools for execution, control, monitoring and analysis of processes
  • Levels 5 and 6, agile business structure: simulation and integrated value analysis tools for closed-loop connectivity of process outcomes to operational and strategic outcomes

He advocates using the simplest tools possible at first, creating some models and learning from the experience, then evaluating more advanced tools that cover more of the enterprise’s process modeling requirements. He also points out that you don’t have to wait until you’re at maturity level 3 to start using a BPMS; you just don’t have to use all the functionality up front.